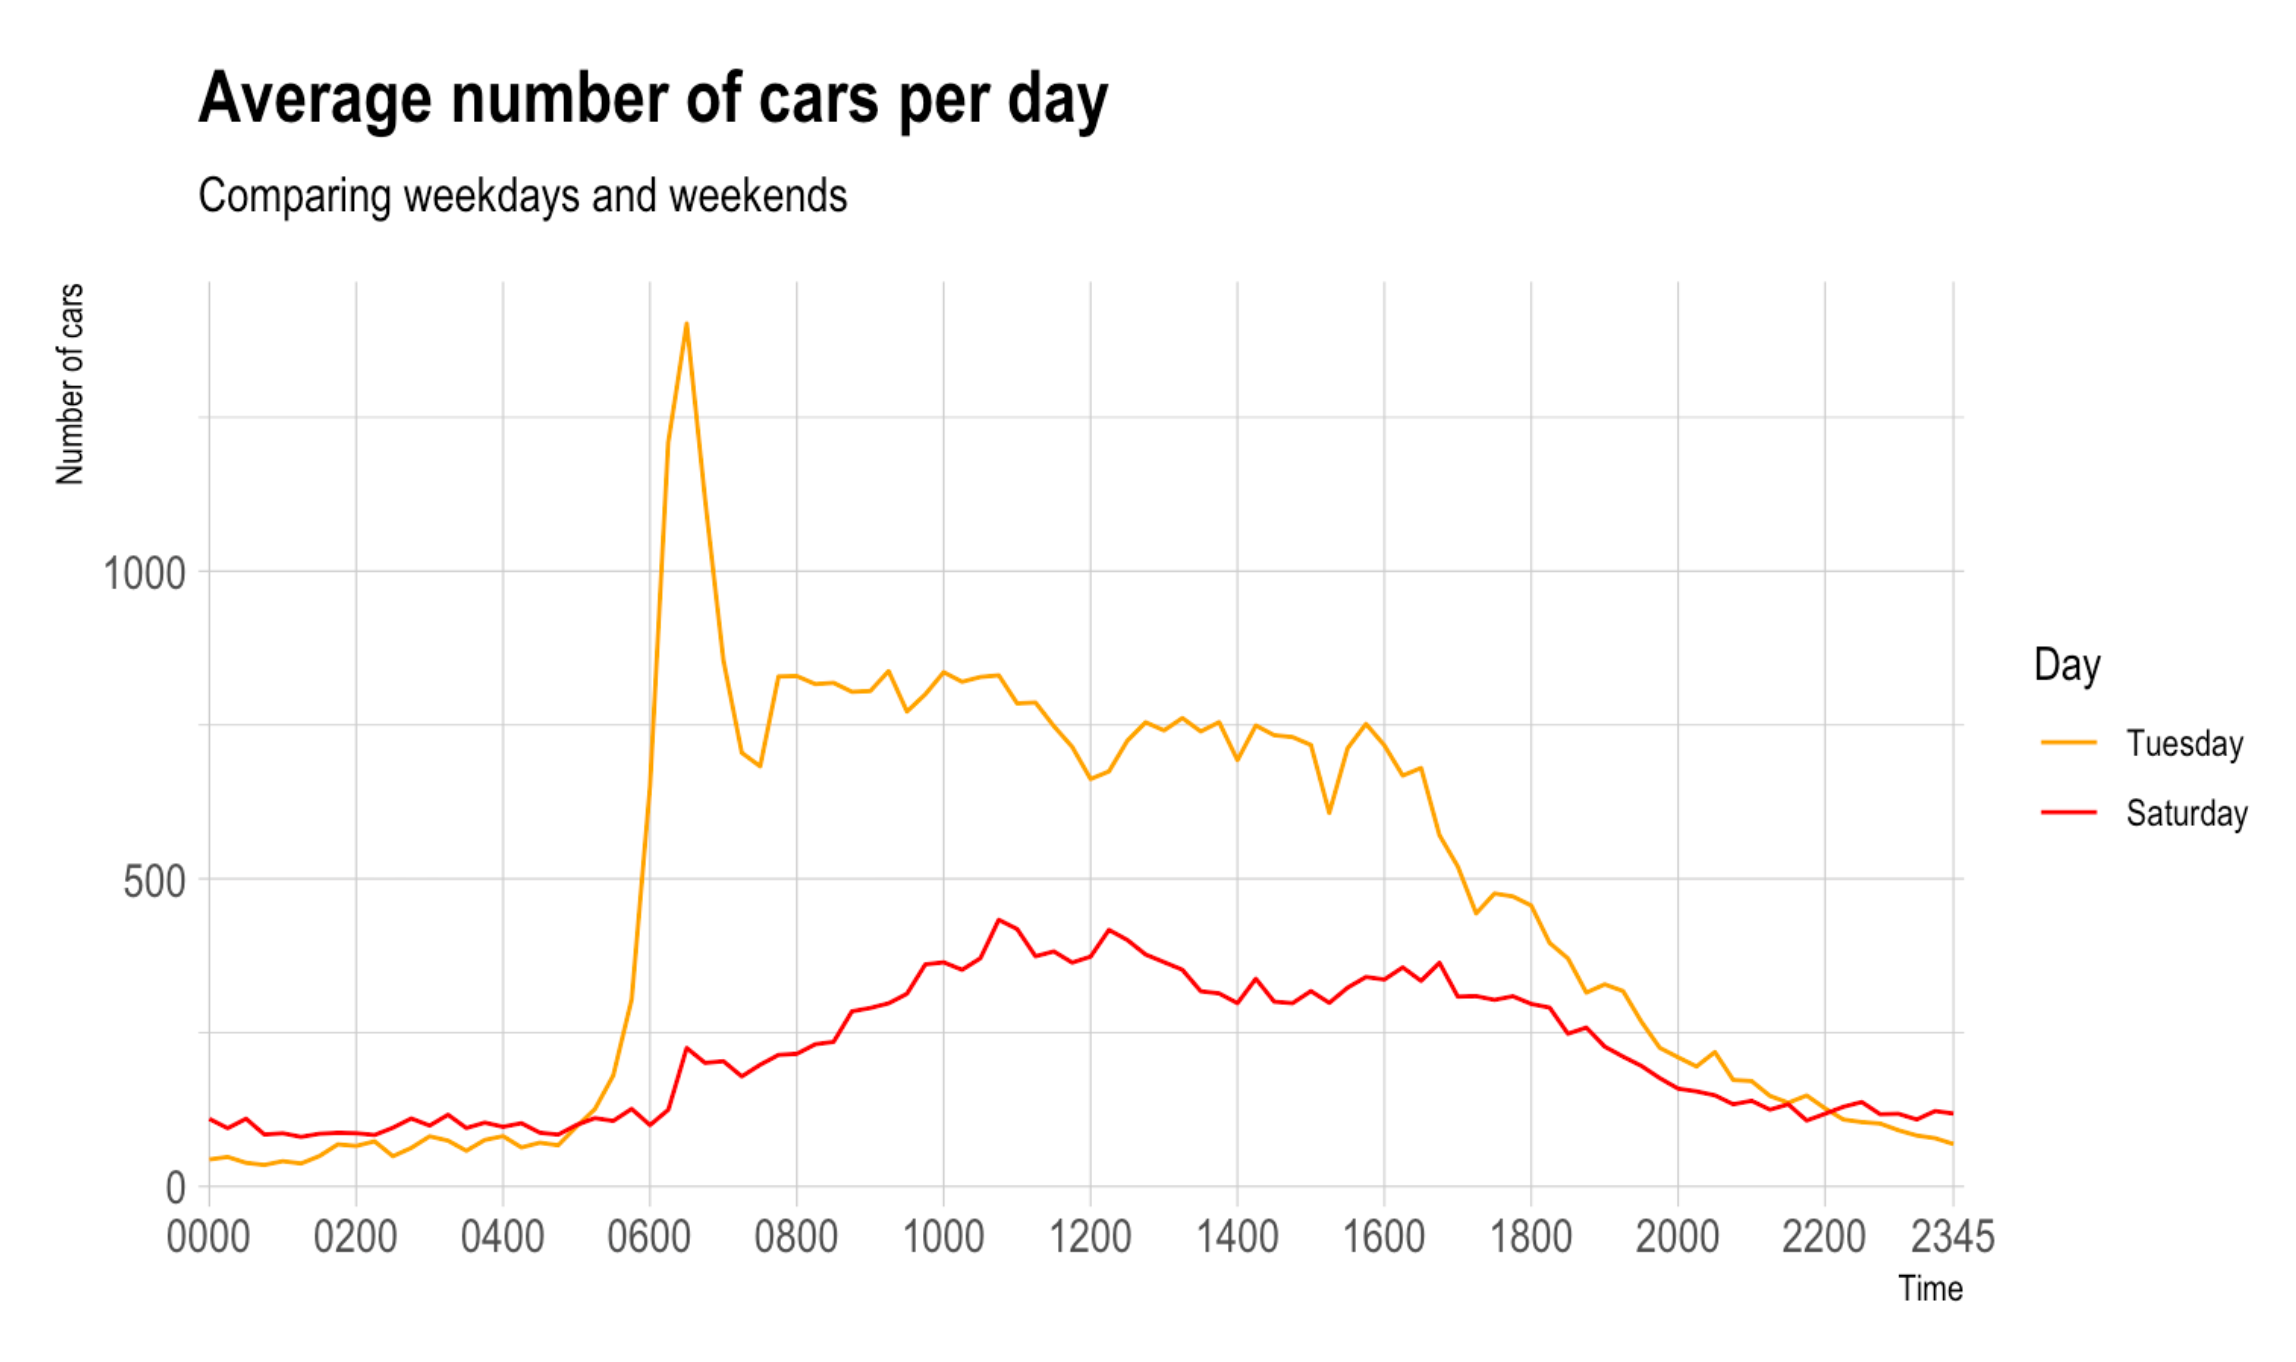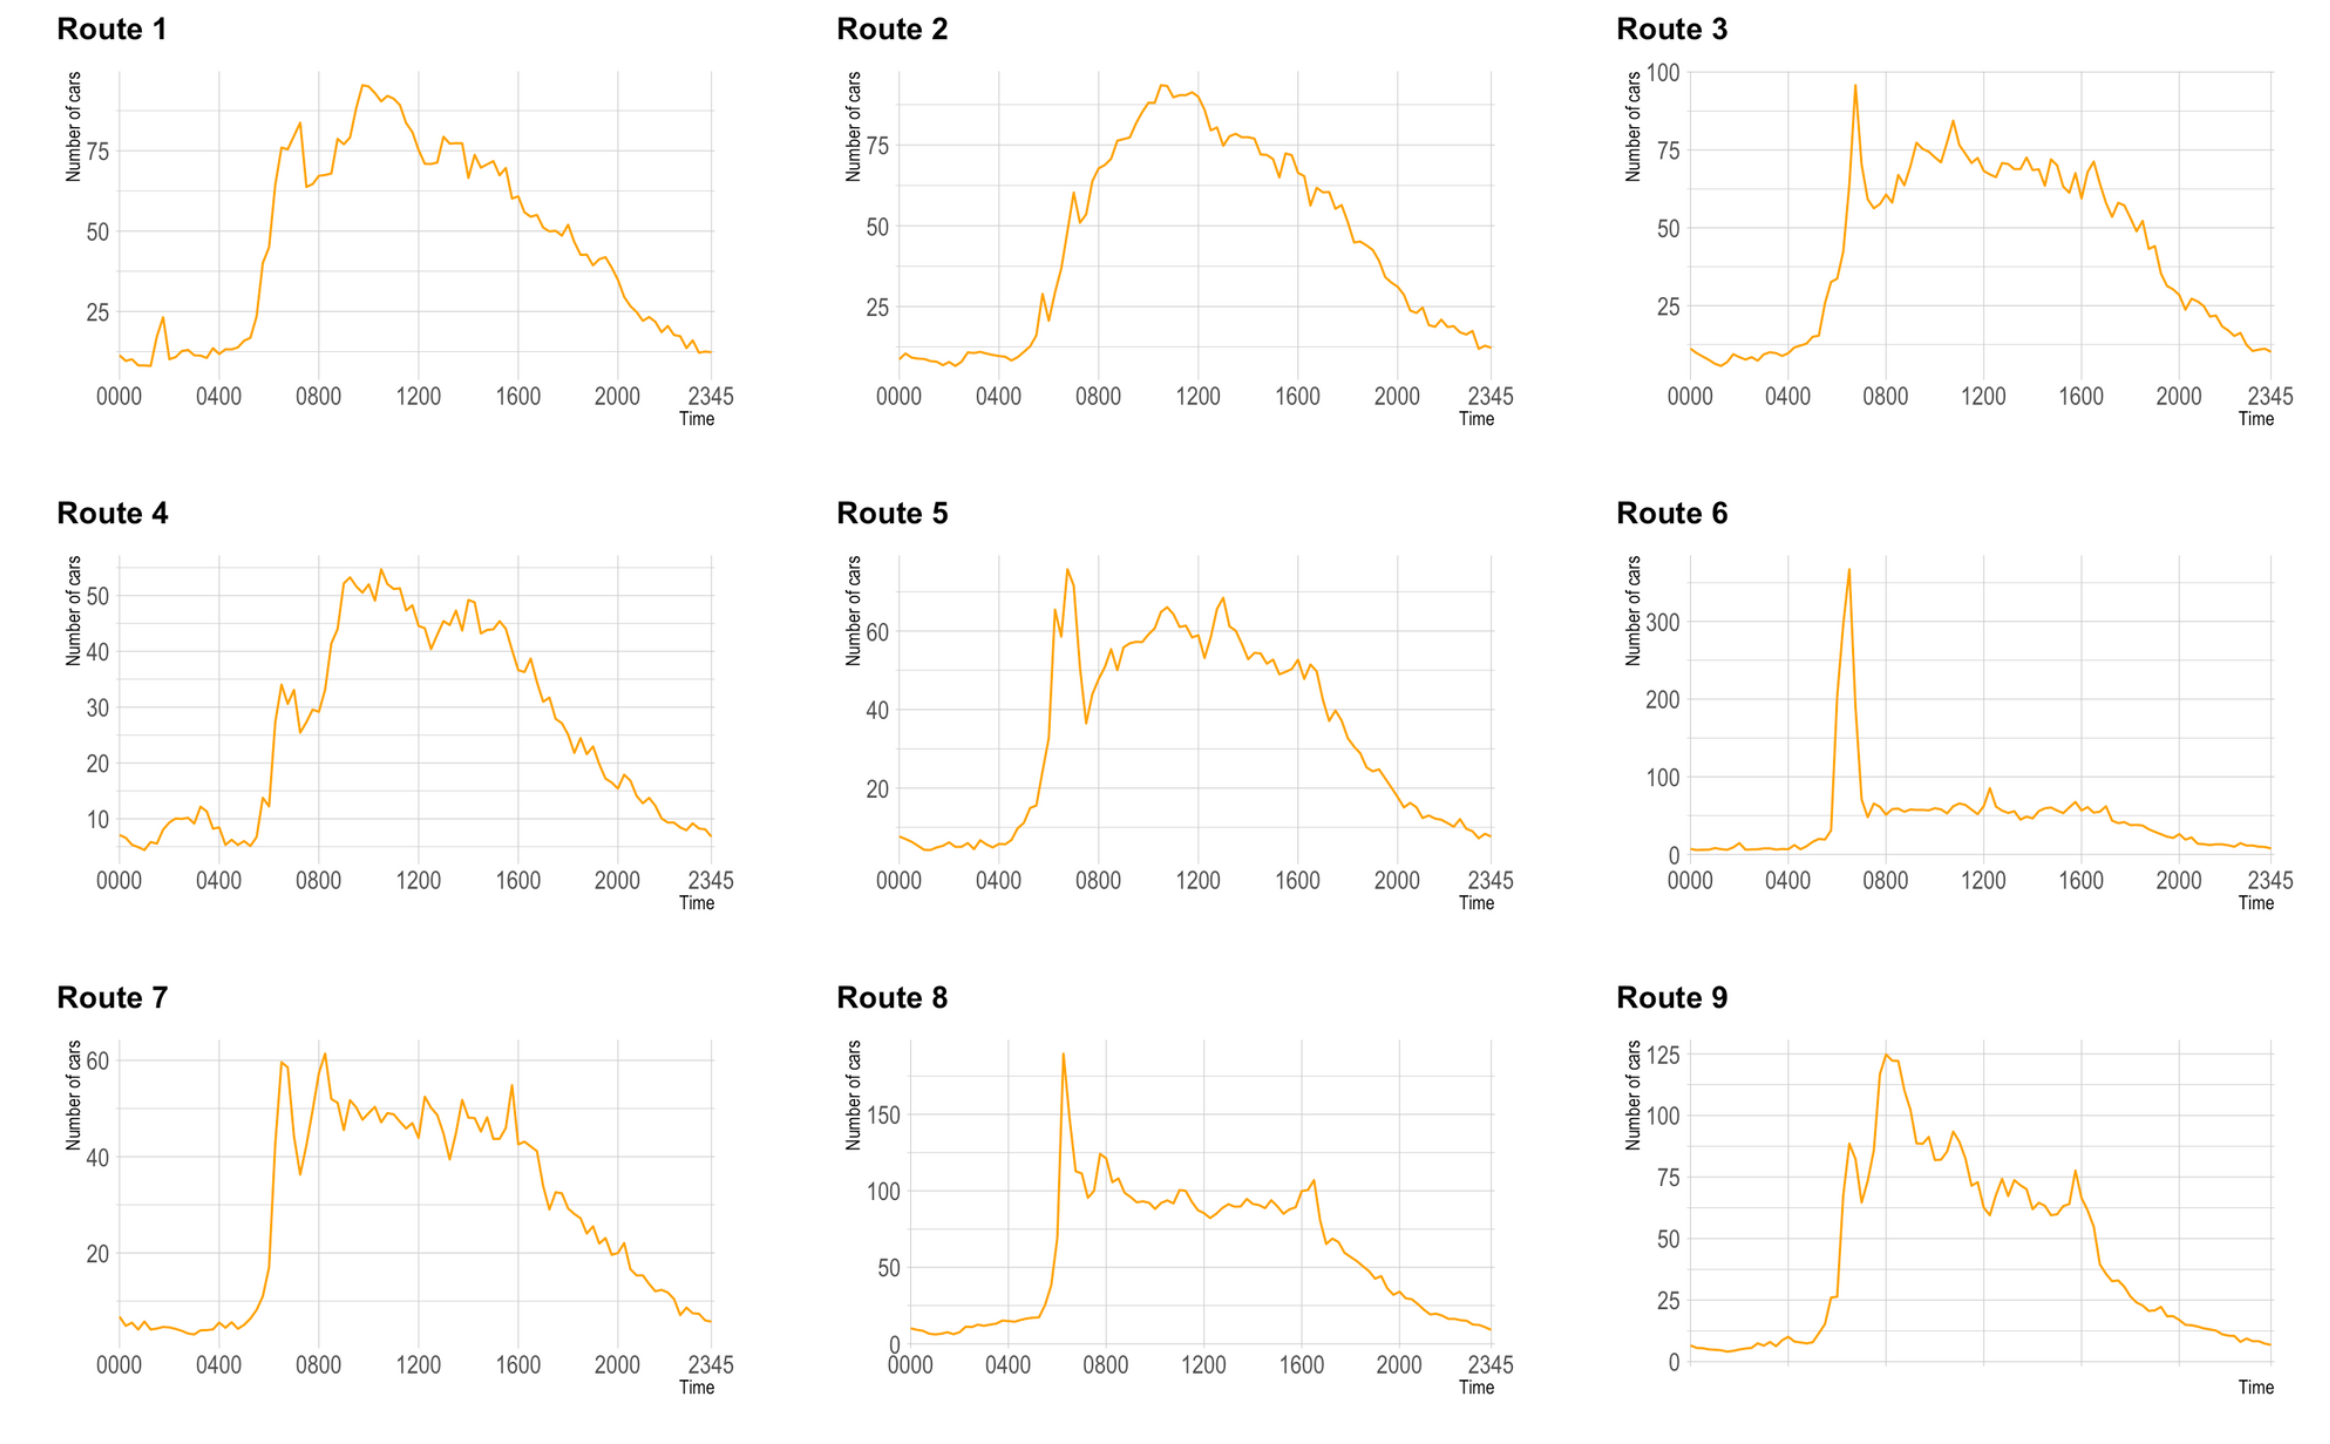

A study focusing on the primary entry routes to Salzburg.
Using R, QGIS, and Adobe
for Cartography Master, 2022.


Our research questions were: How does speed vary as time changes? How does speed vary as location changes? and how does speed vary as time and location change? Three main visualizations were developed to answer them: A spacetime cube, a dynamic representation of velocity along specific routes, and the following map featuring speed through a typical weekday:
Softwares used: R, QGIS, Illustrator and Photoshop