
The independent group Sistemas Materiales, invited me to work on the visualization of the latinamerican community working with biomateriales for an exhibition at kunstgewerbemuseum in Berlin.
Sense-making, data mapping and design for Sistemas Materiales, 2024.

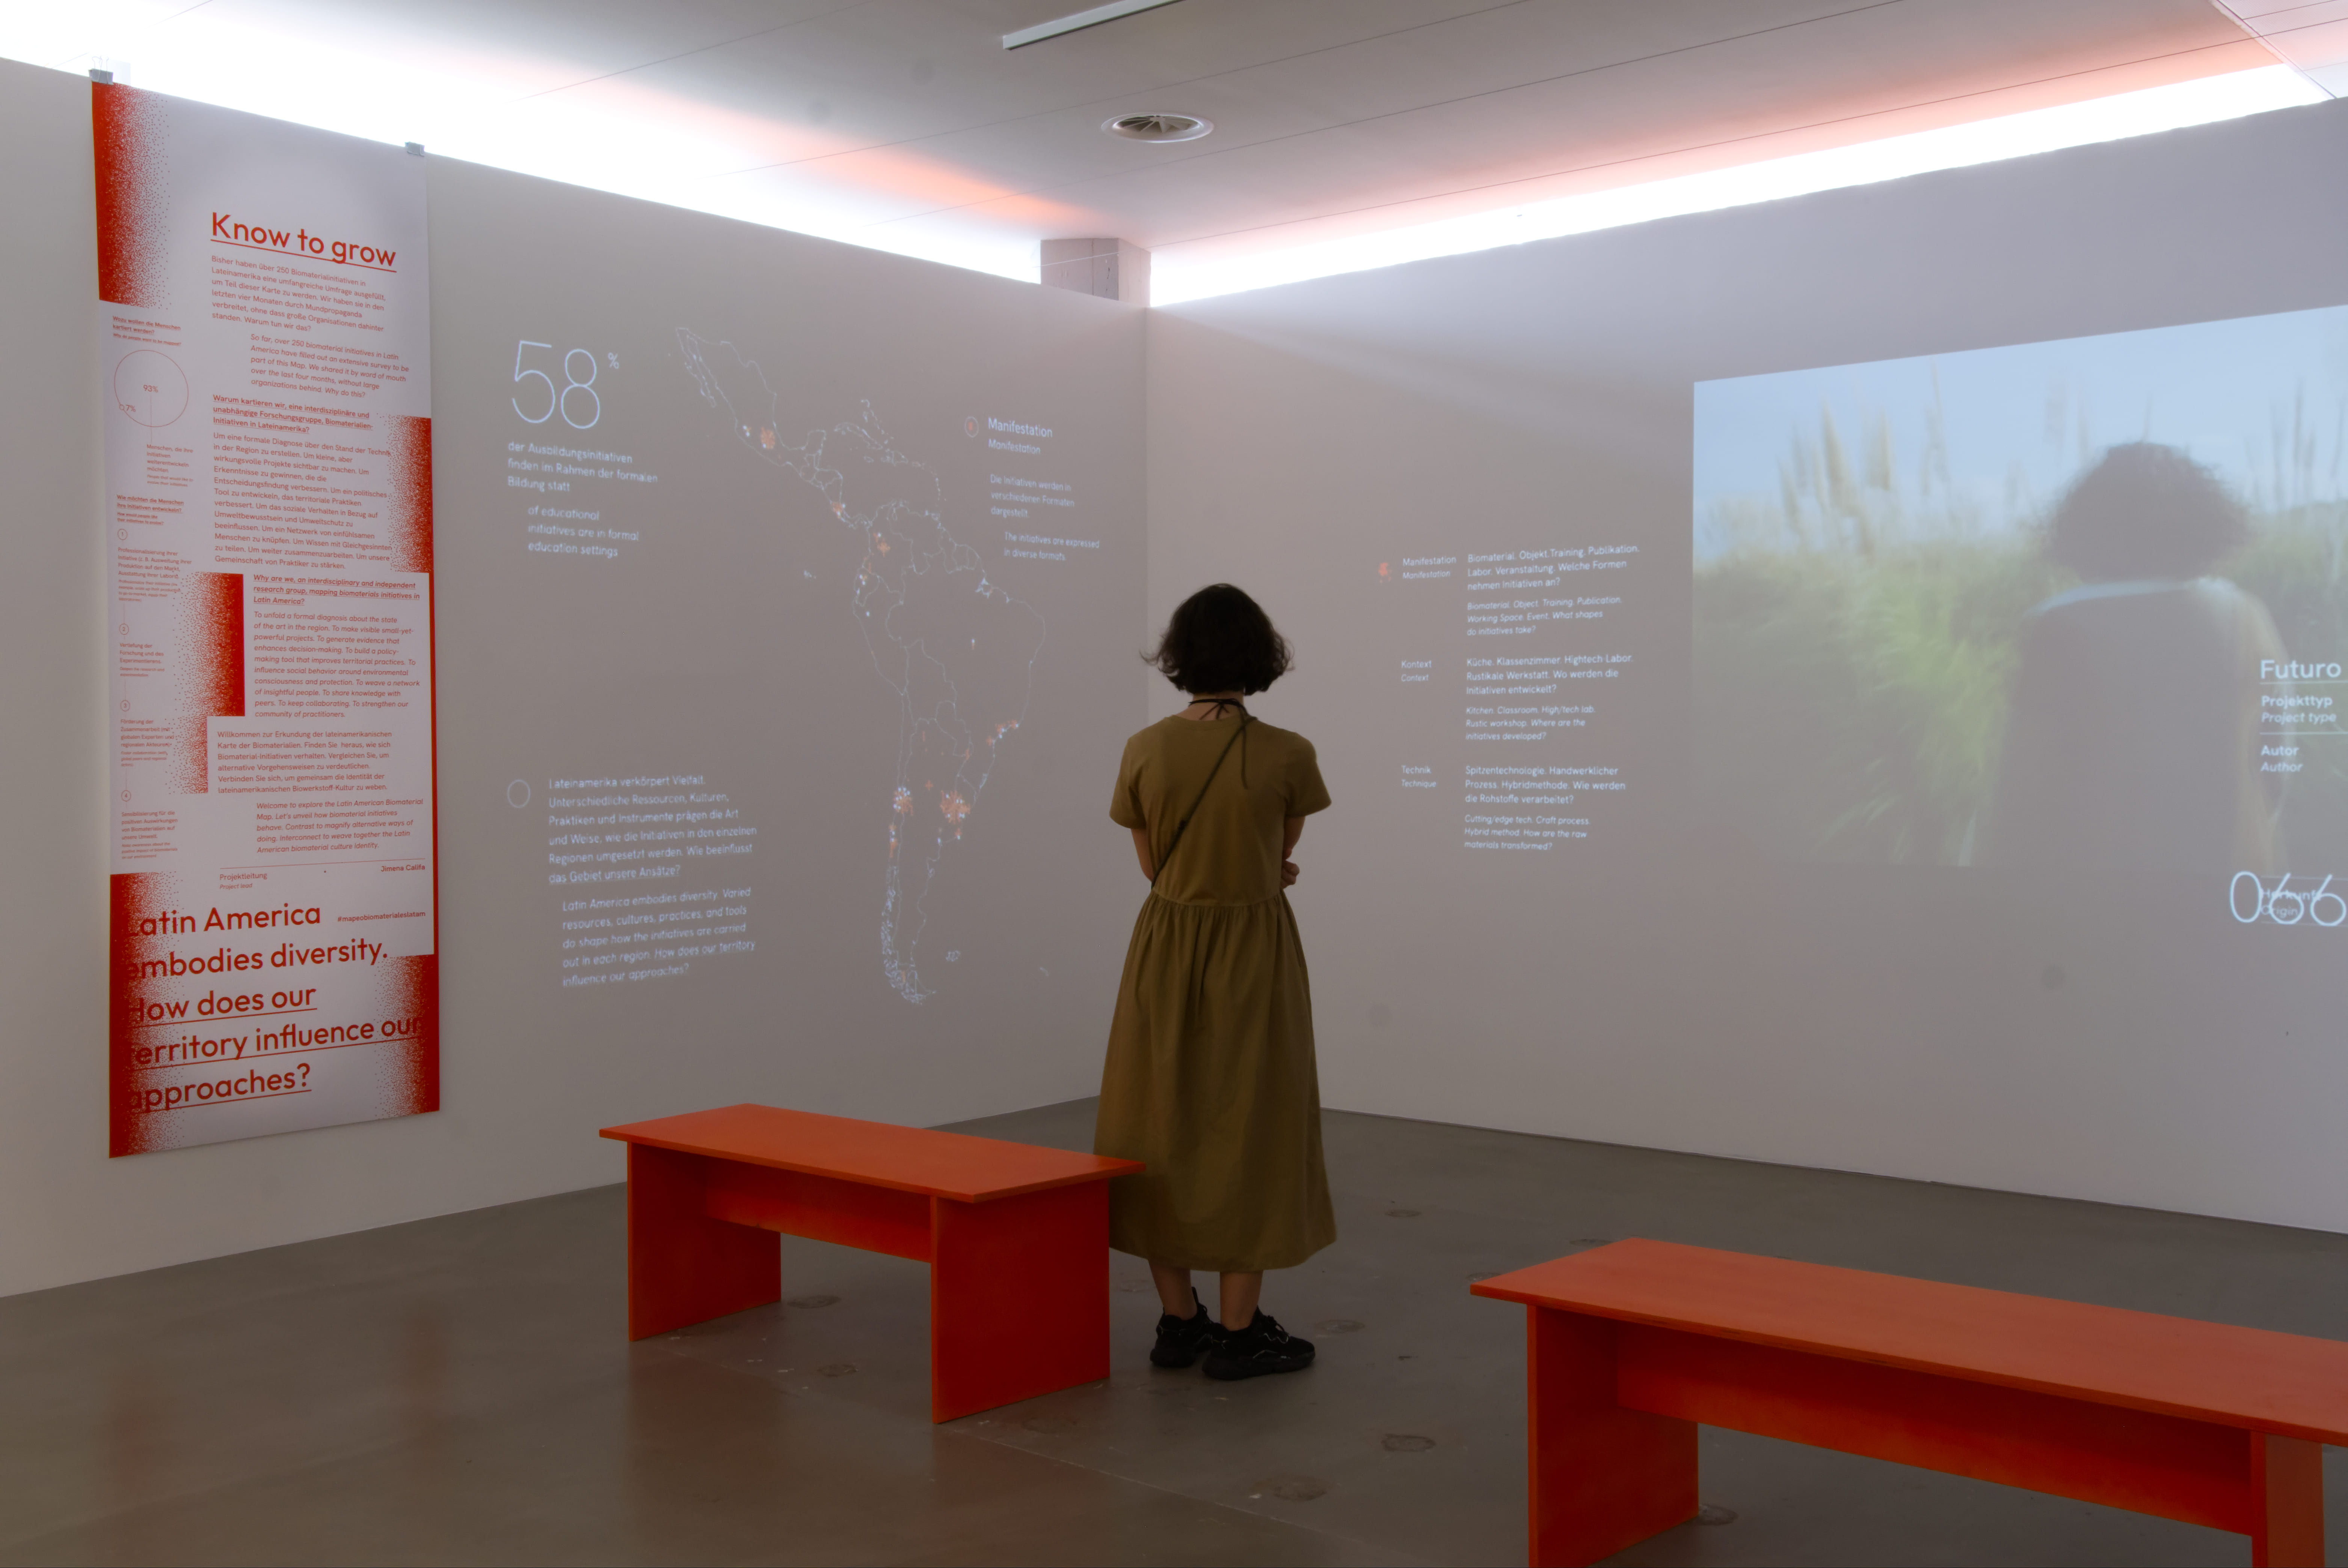
The task was not easy. Usually, when we think about a map, the geographical one is the first that comes to our minds. But here, geography is just one of the dimensions being mapped. We are mapping a system, where stakeholders and their value network are in the center of the scene, the relationships between people, process, and environment.
The analysis followed a system thinking and collaborative approach. For 3 months, we made sense of the data, discover stories to tell, capture learnings, and find patterns and relationships between presented initiatives.
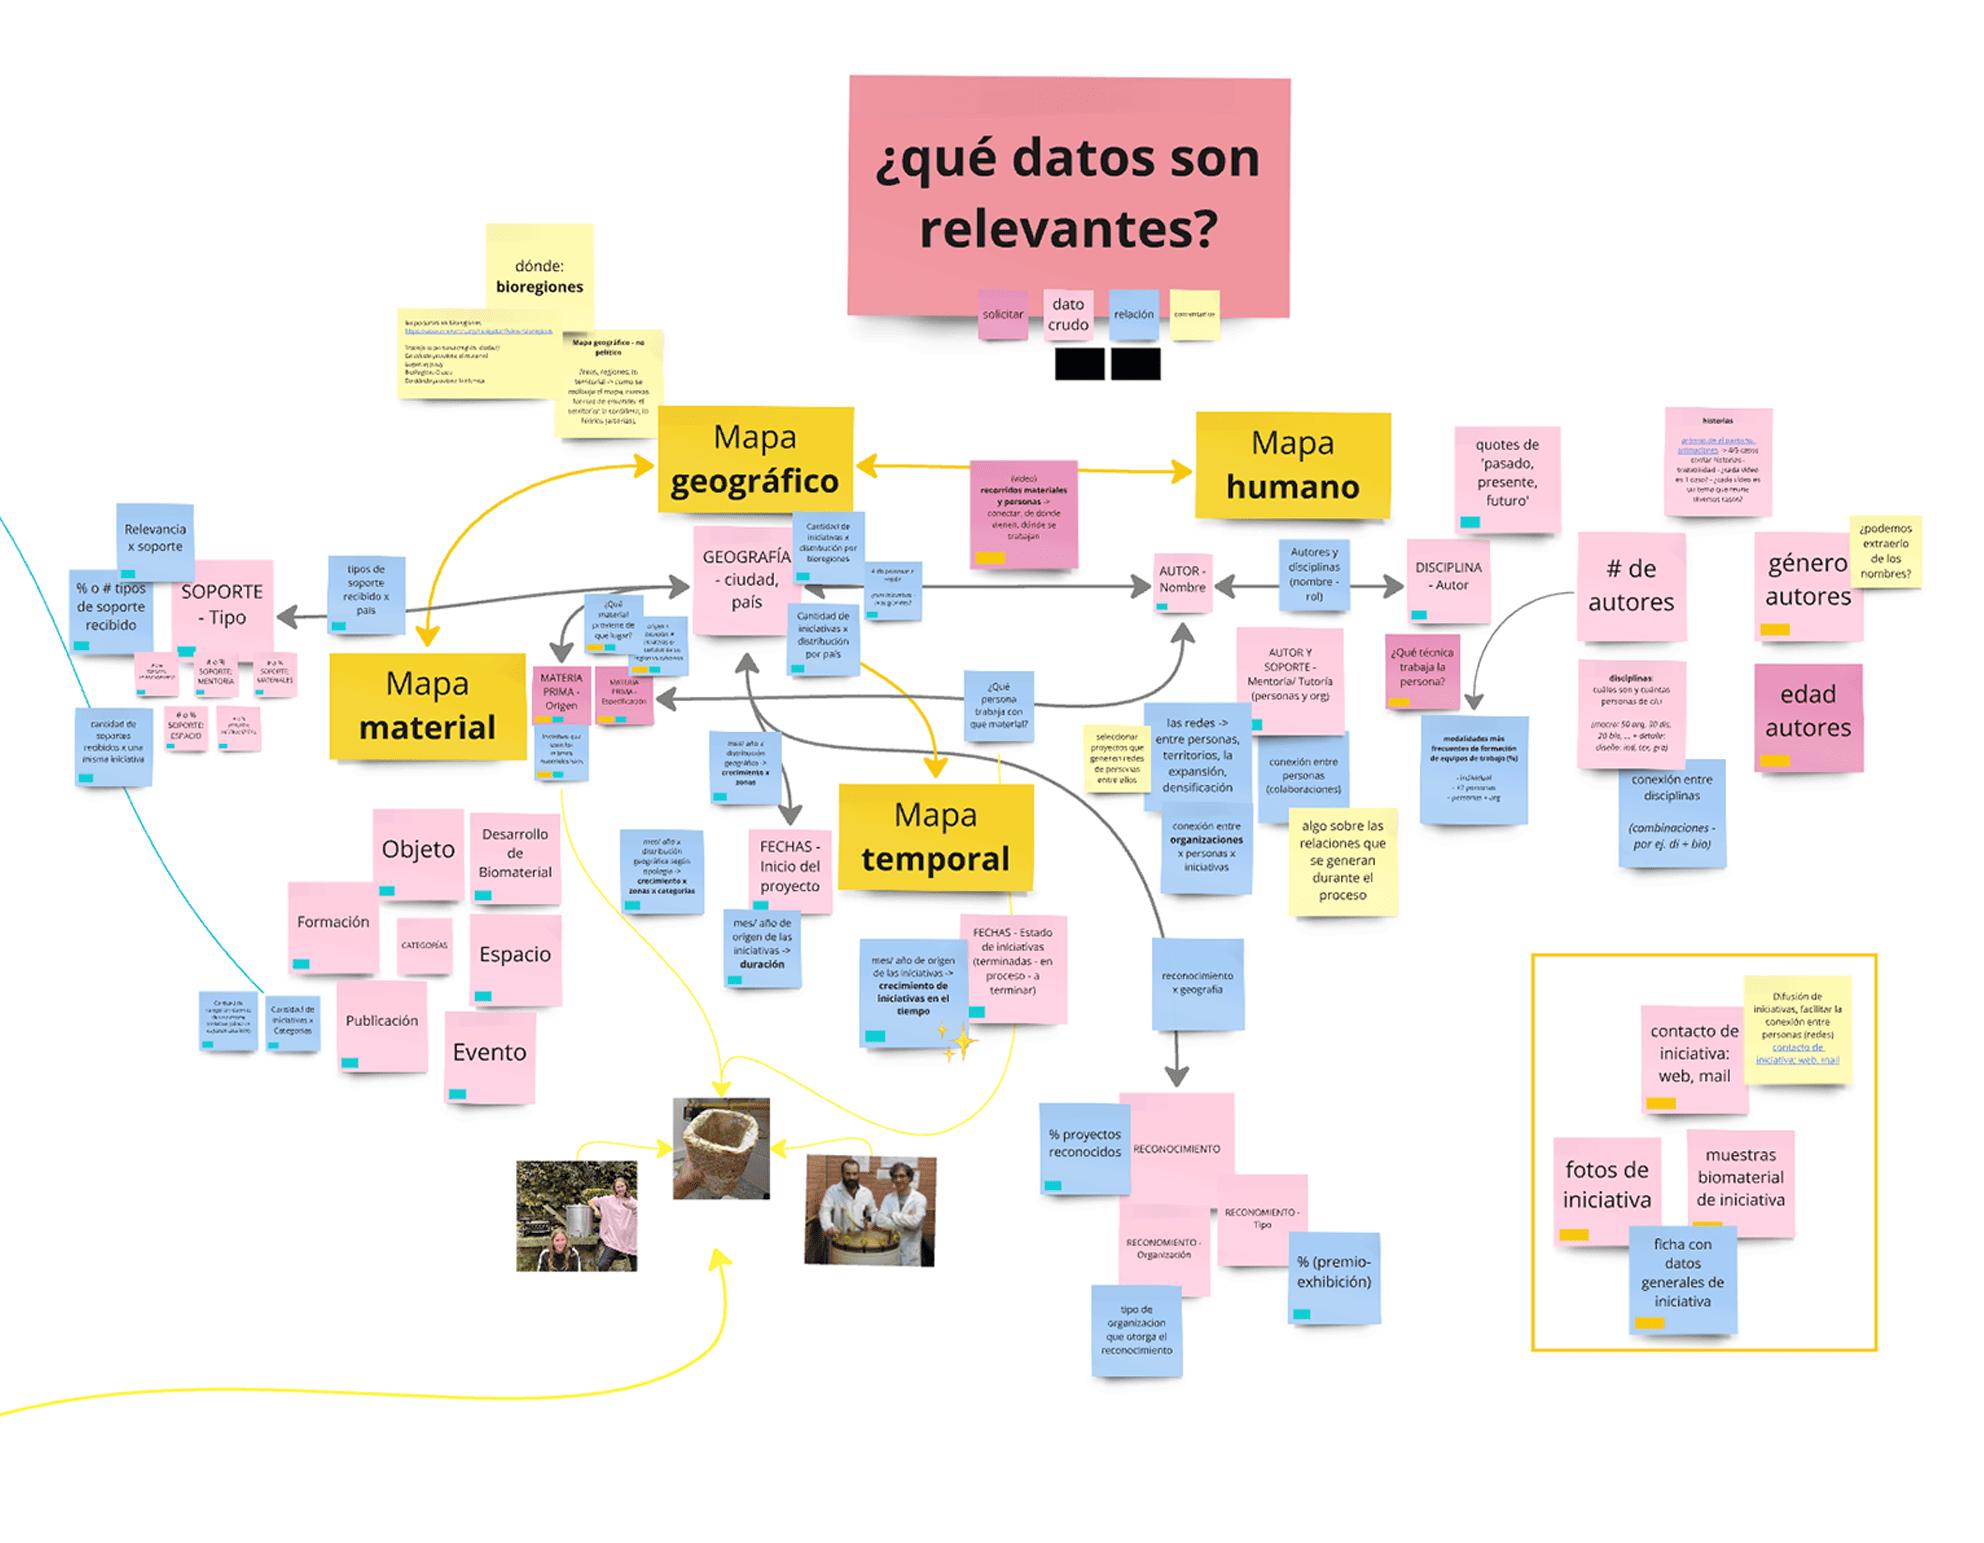
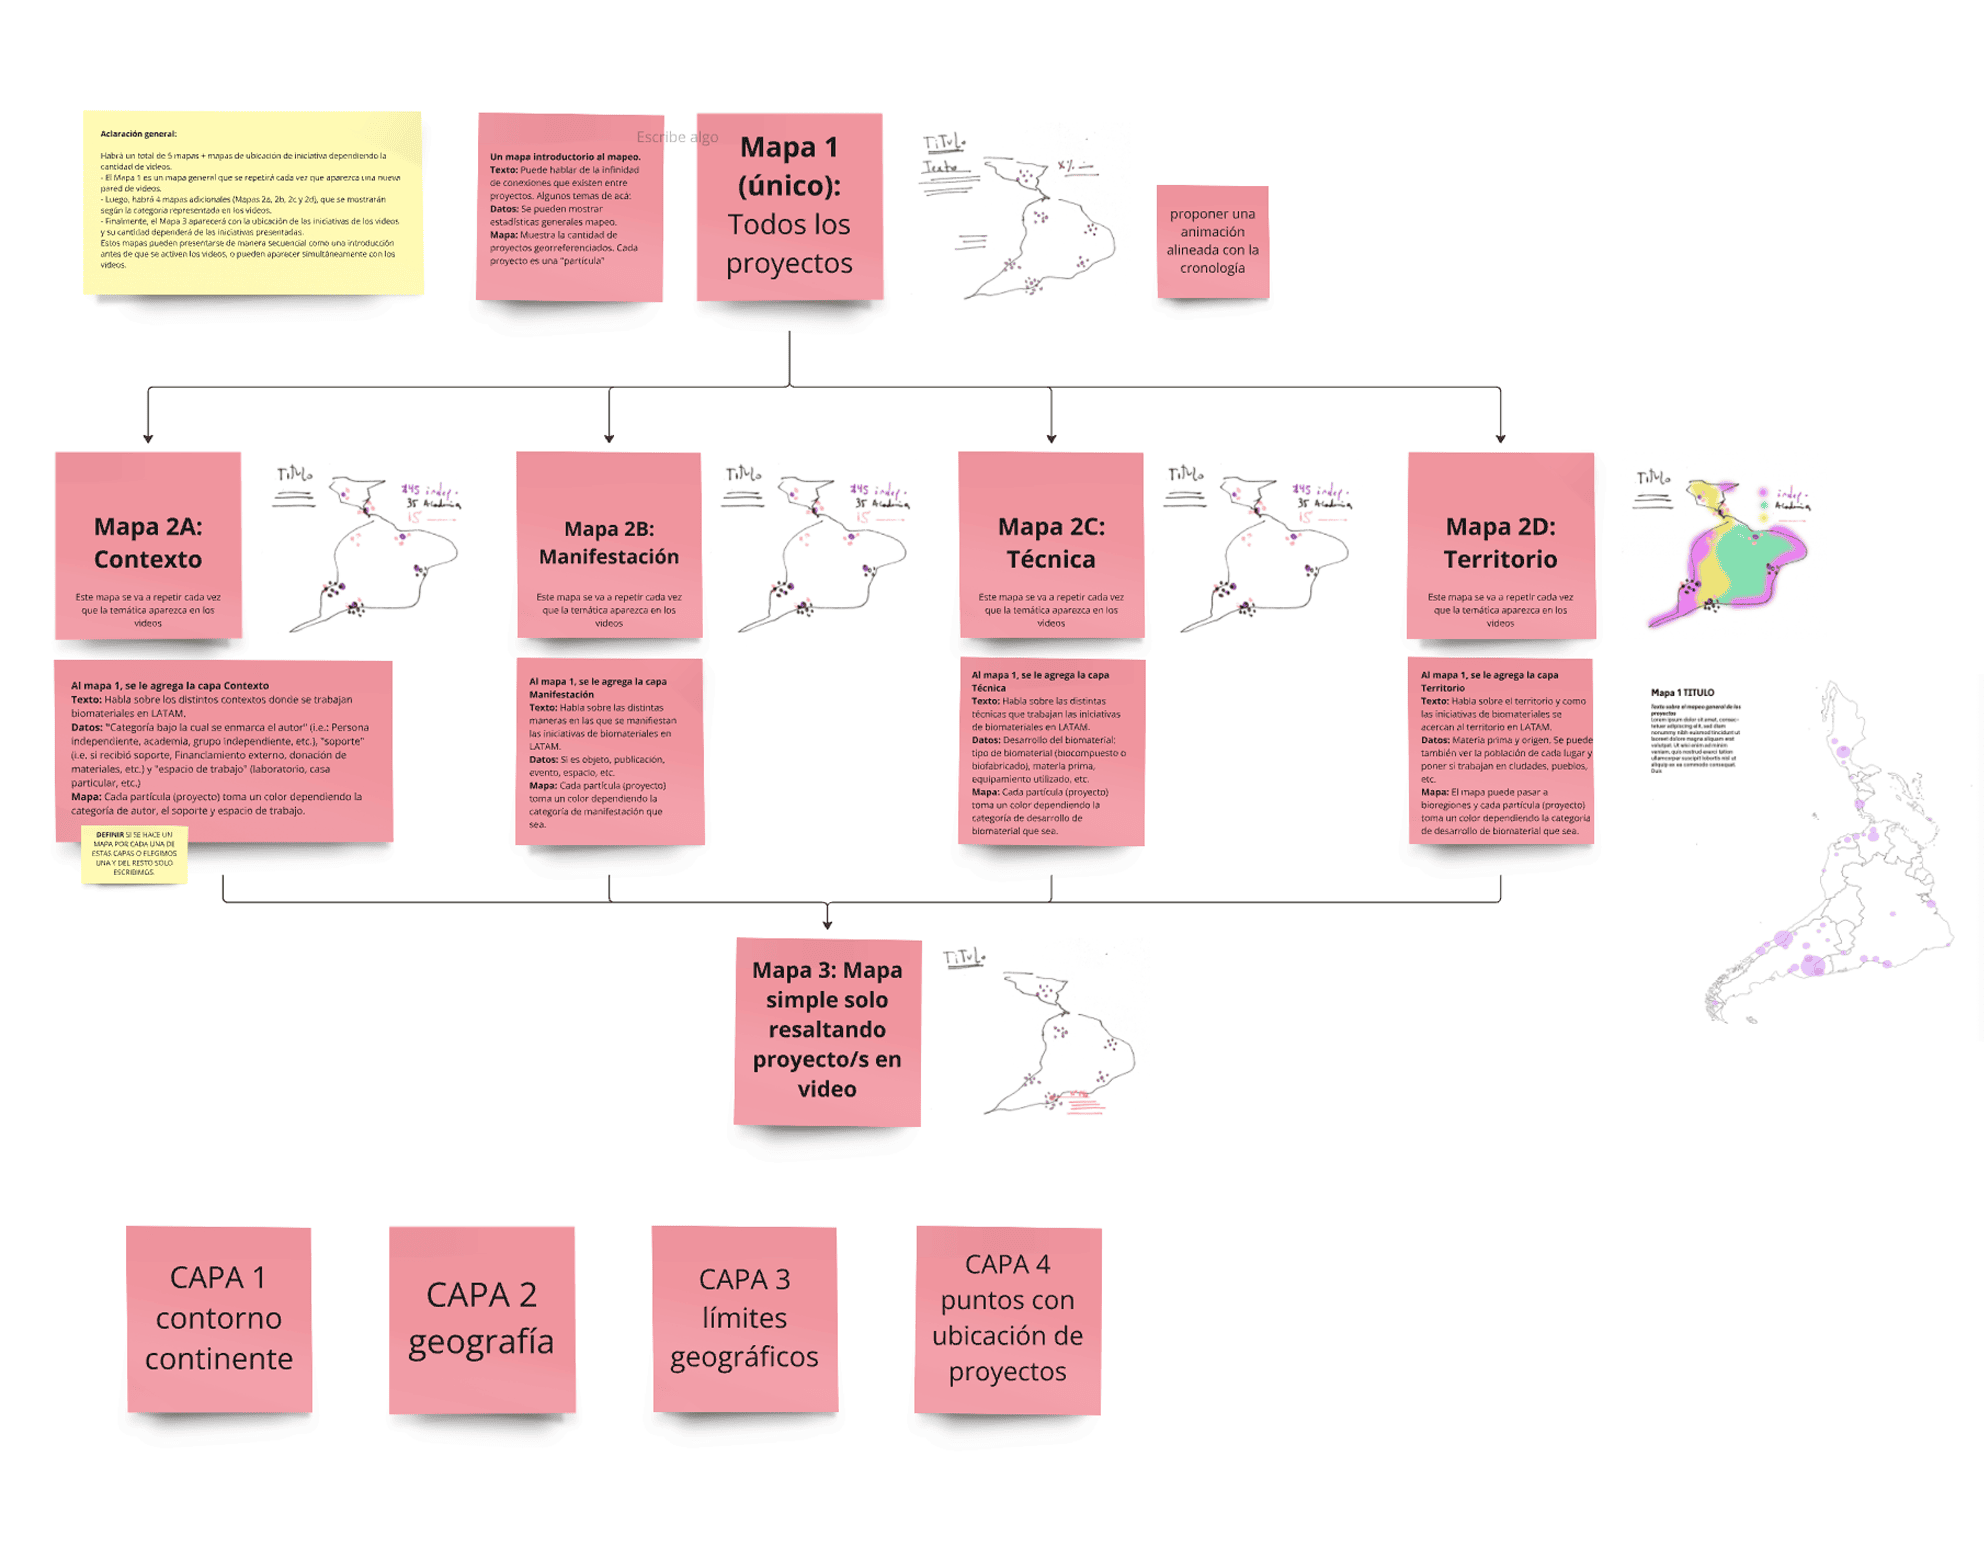
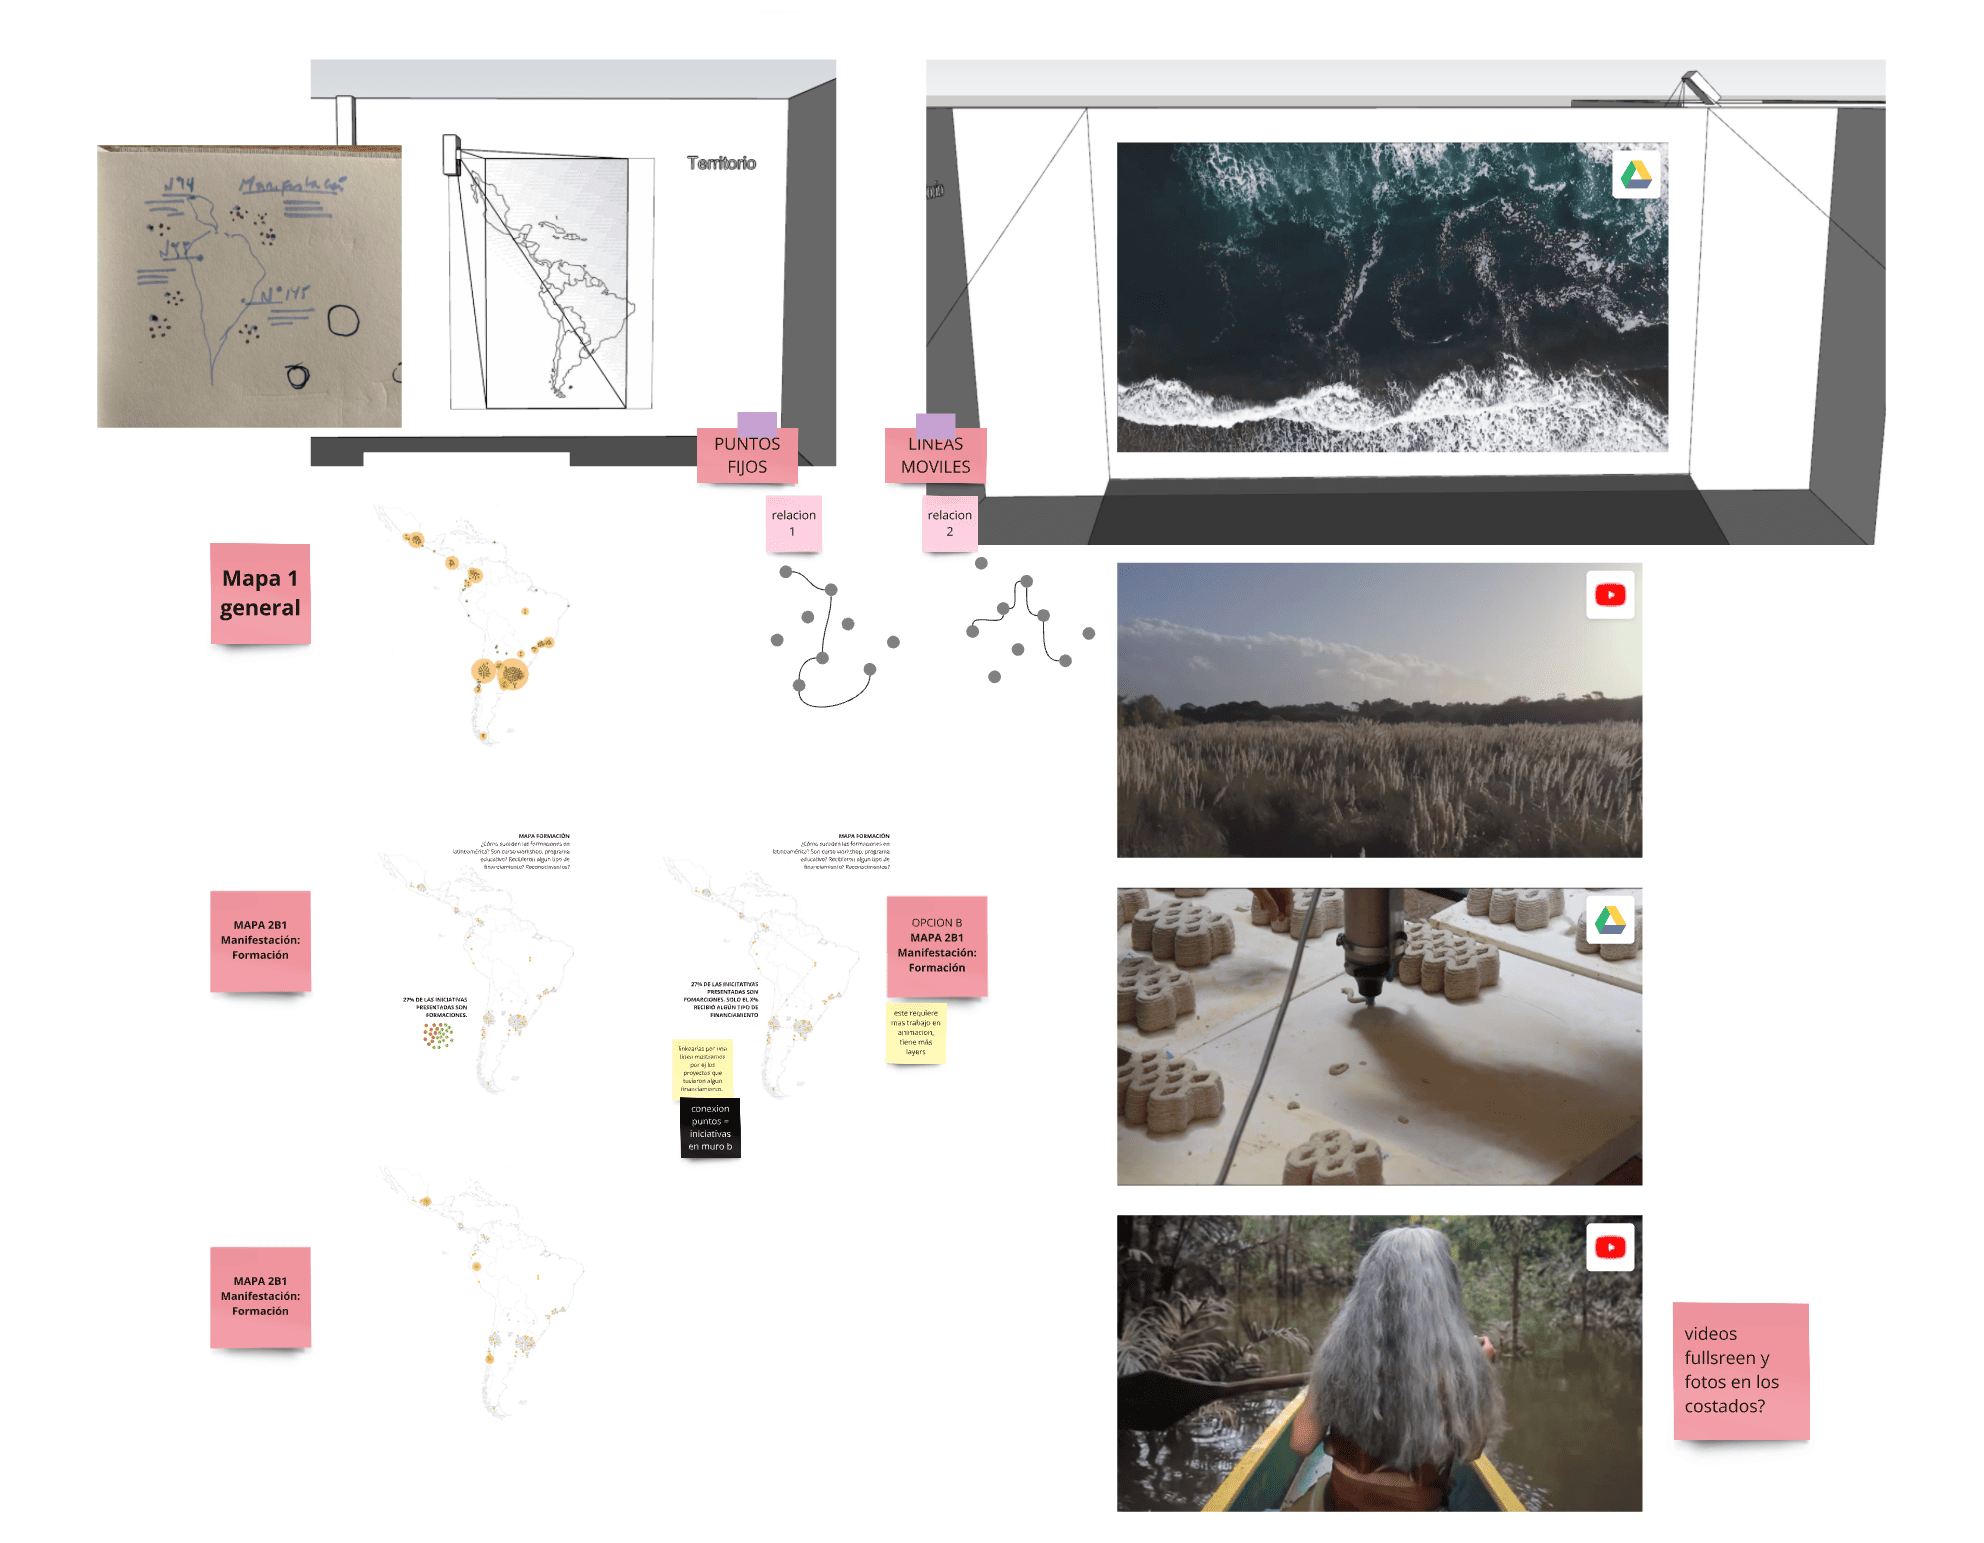
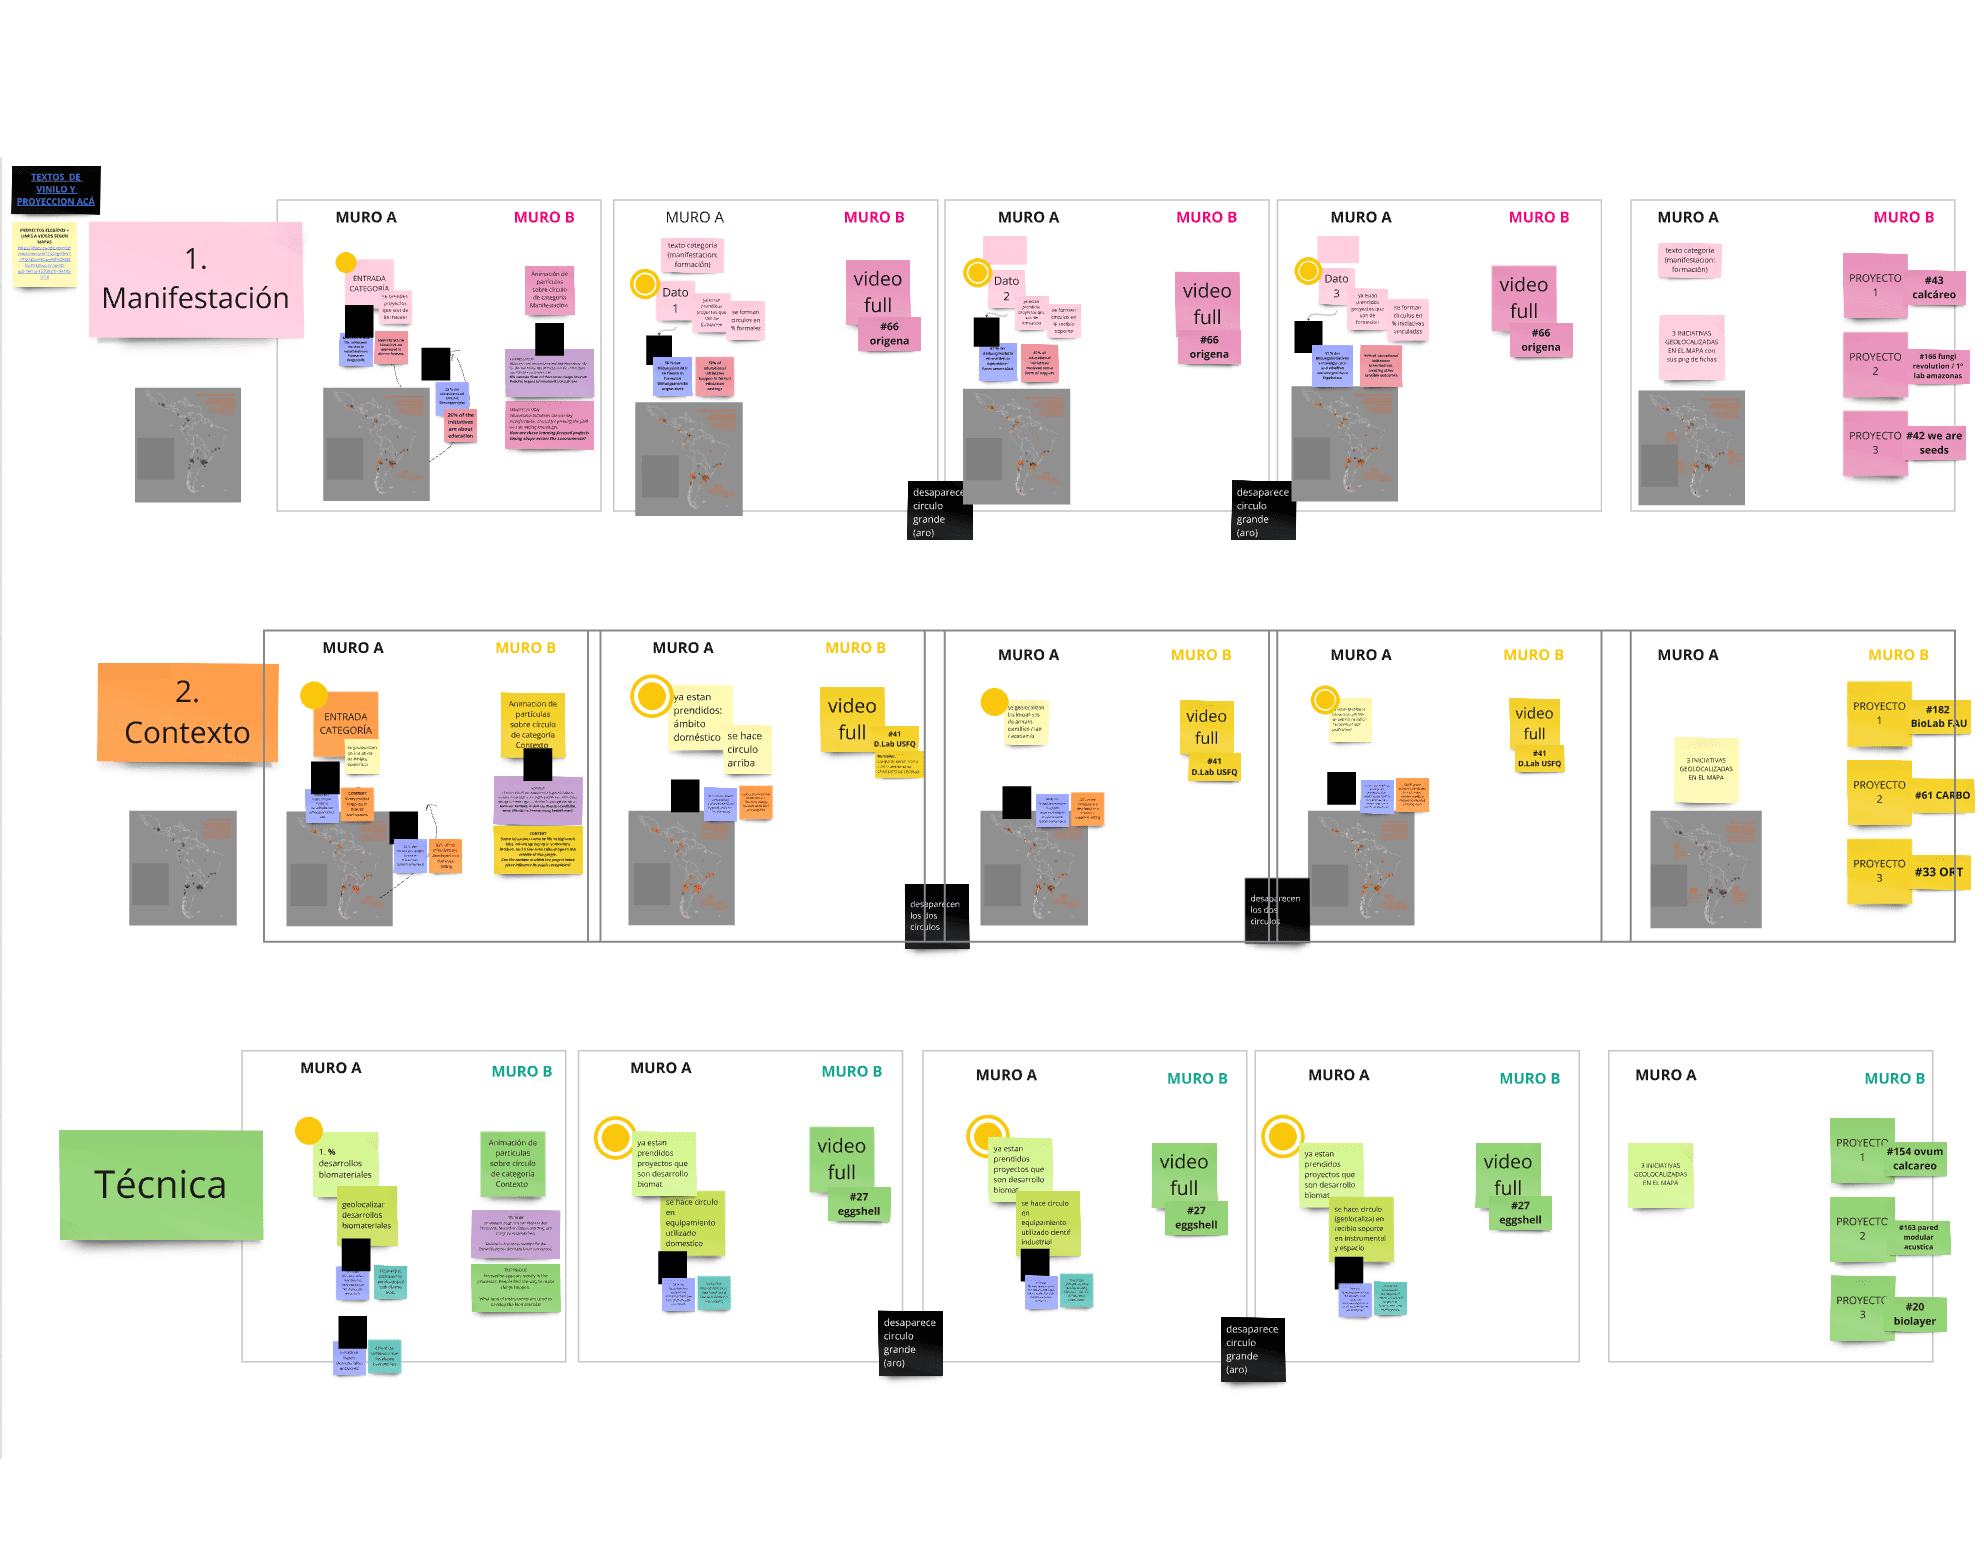
When we understood what these all meant, we represented the findings using storytelling and visual resources. It is important to highlight that in the exhibition we just represented a part of all the findings.
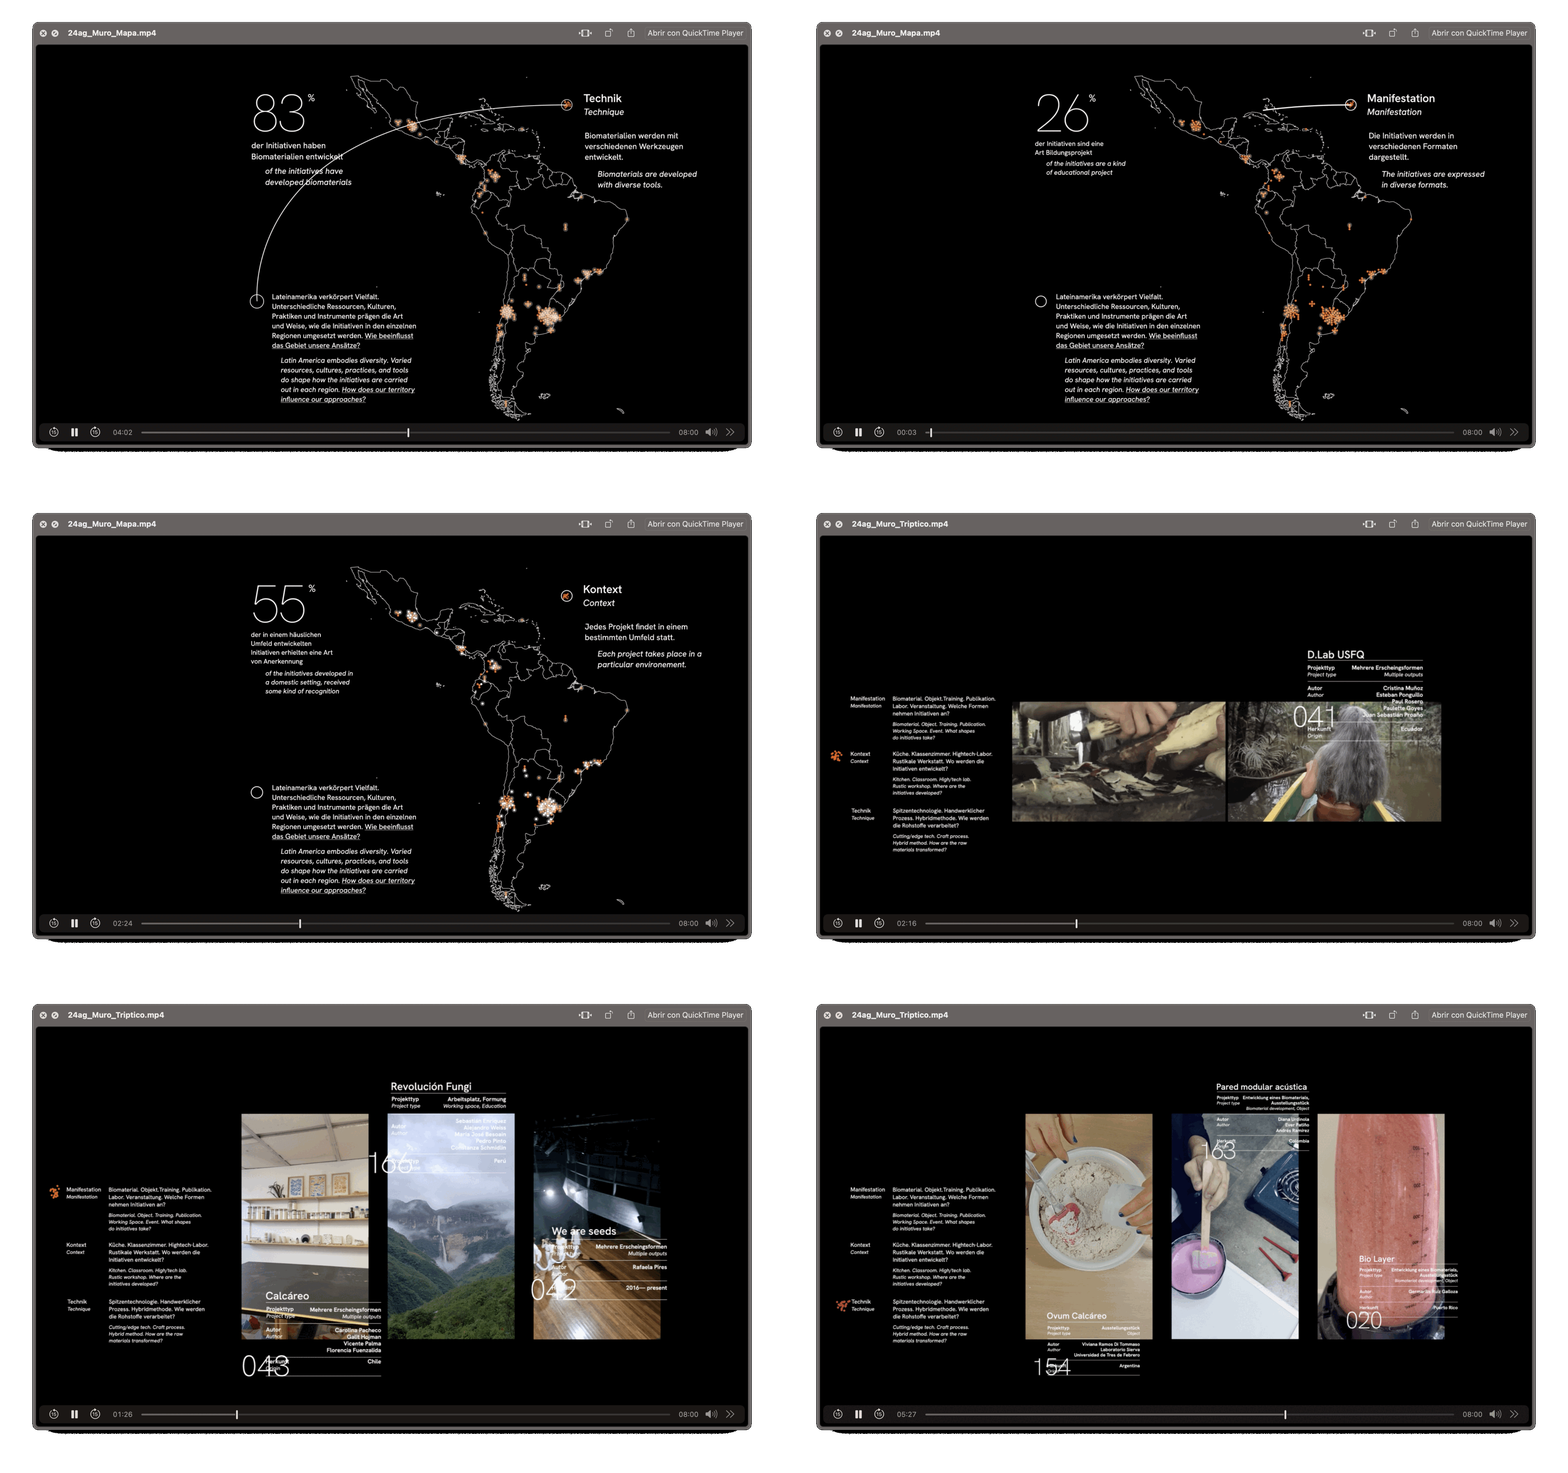
Softwares used: QGIS, Illustrator, Photoshop, and After Effects