Conducted data research and gathering, analysis, and visualization. These maps were part of my master's thesis combining objective data and citizen knowledge. Two visual strategies were used to show the same datasets. These maps were later tested with stakeholders of varying levels of expertise to determine which visualizations were clearer. This analysis was part of my master thesis. September 2023.


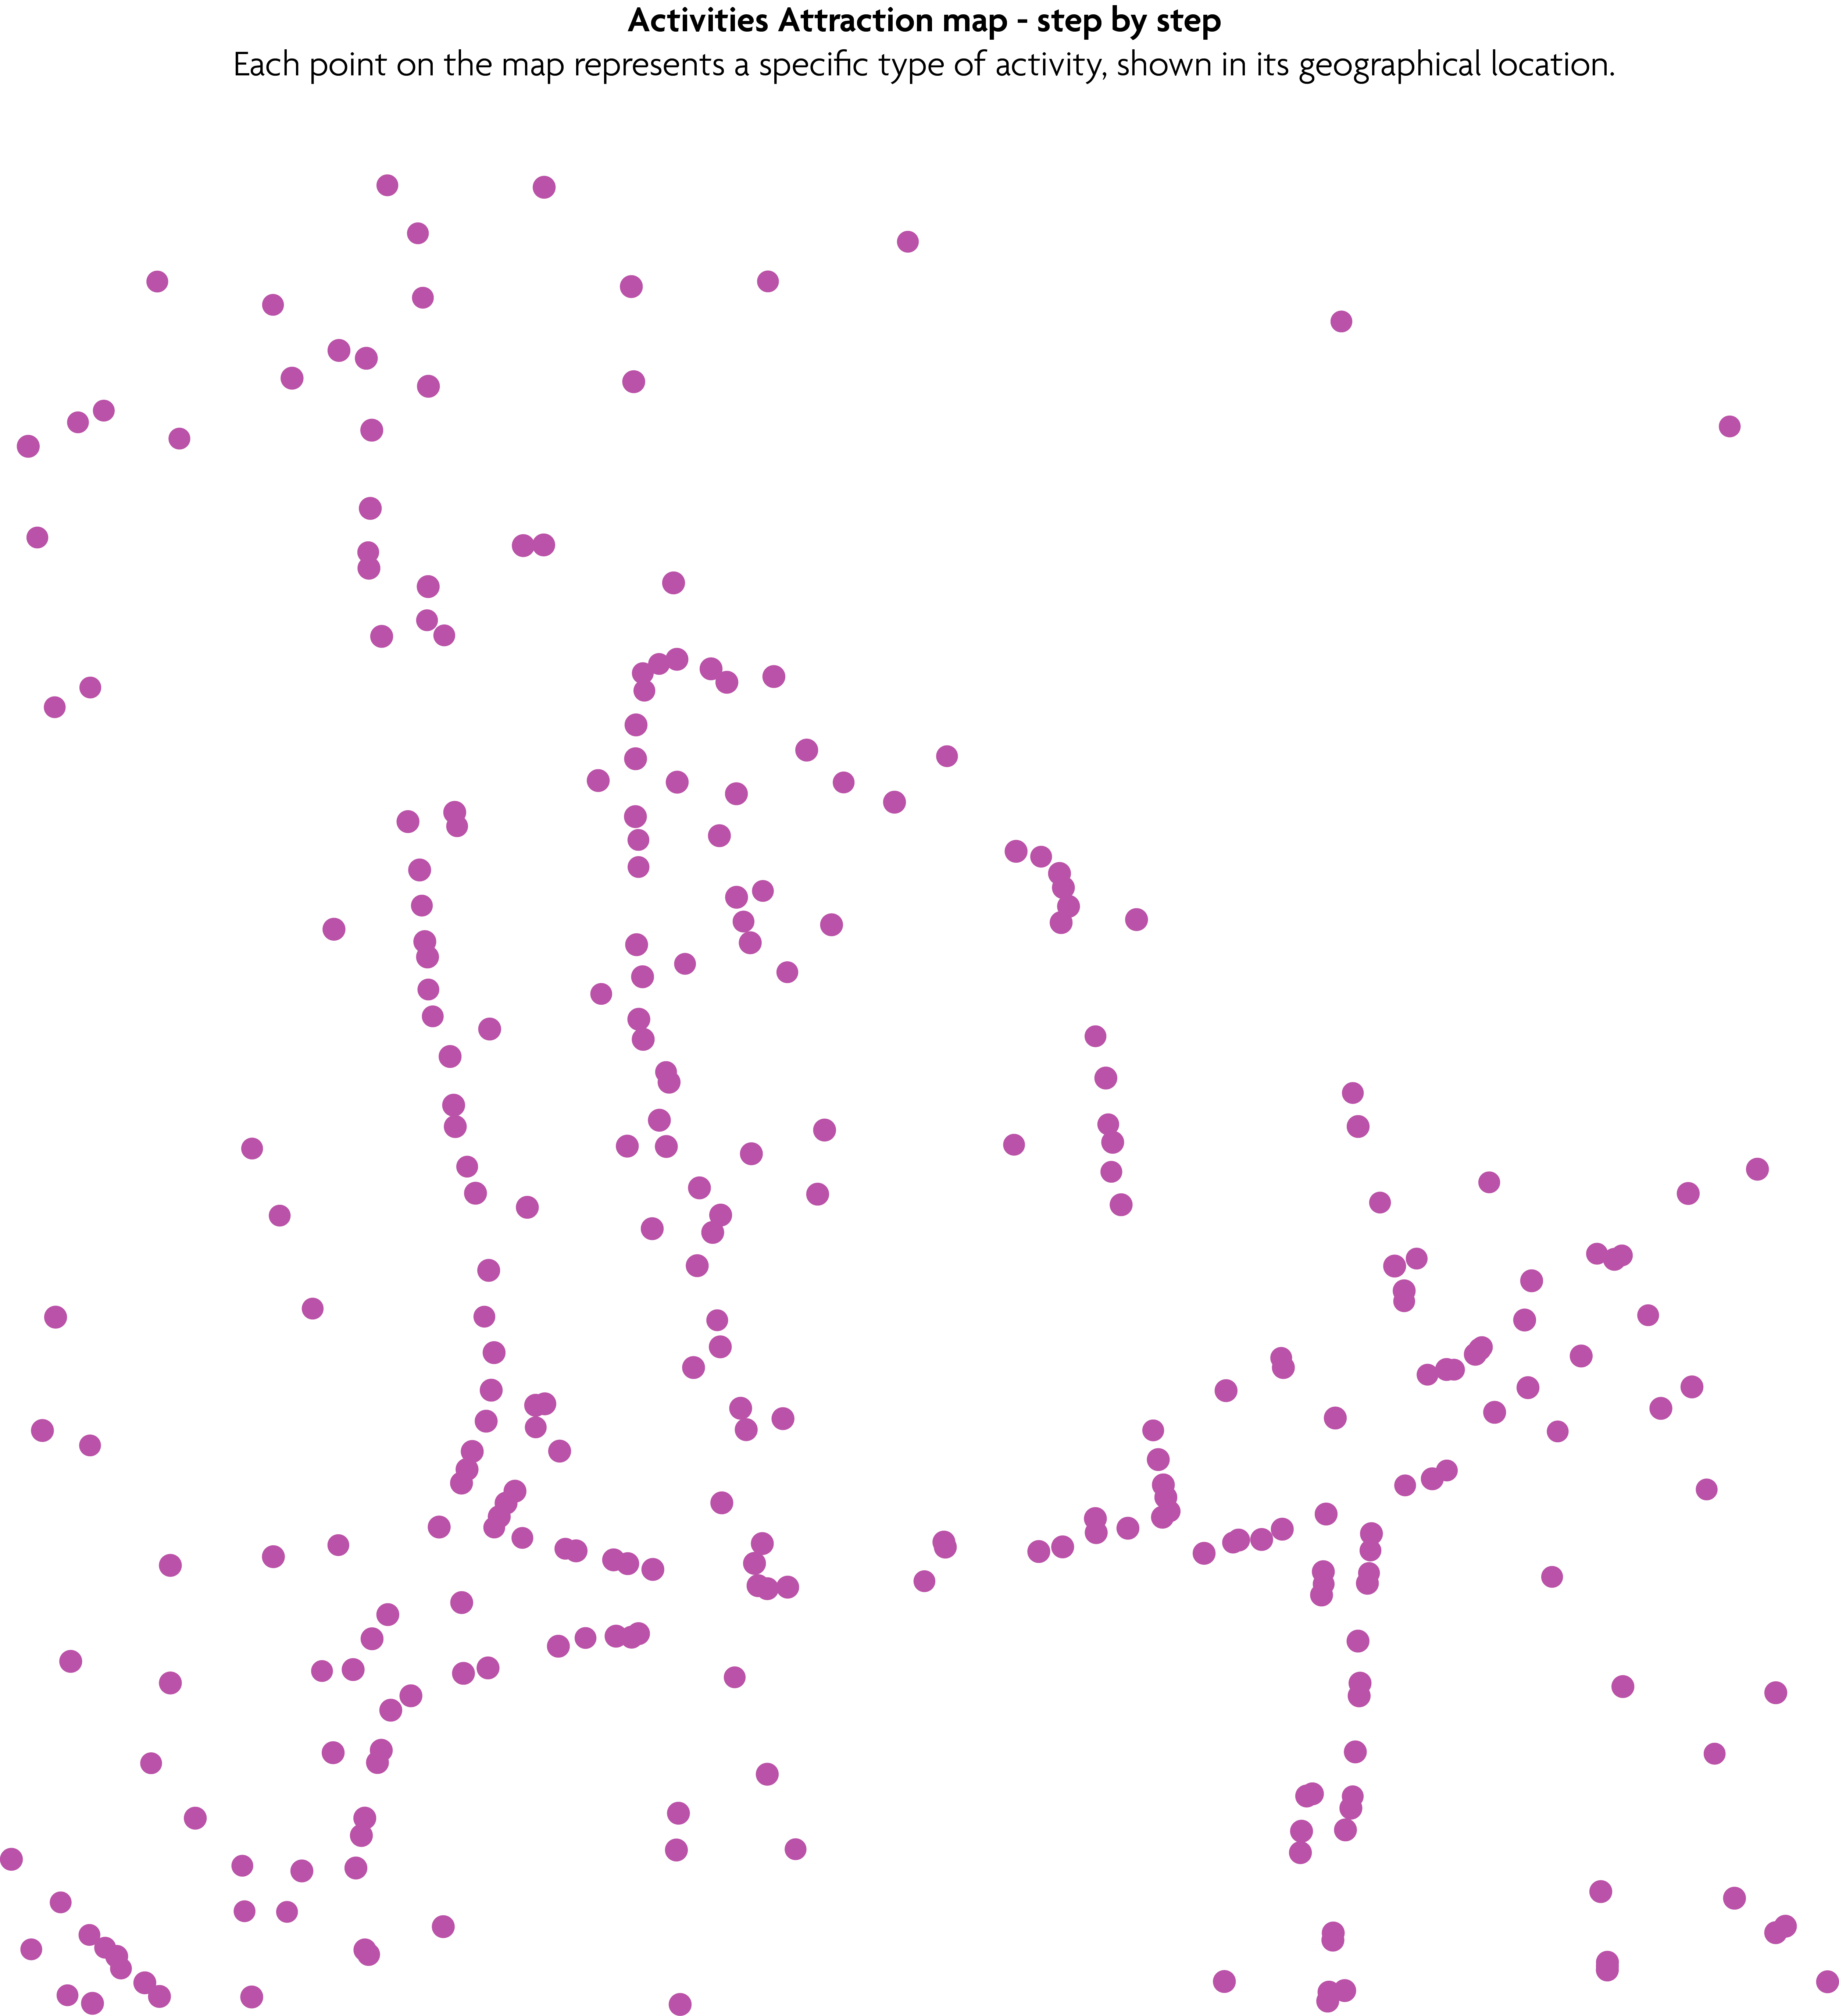
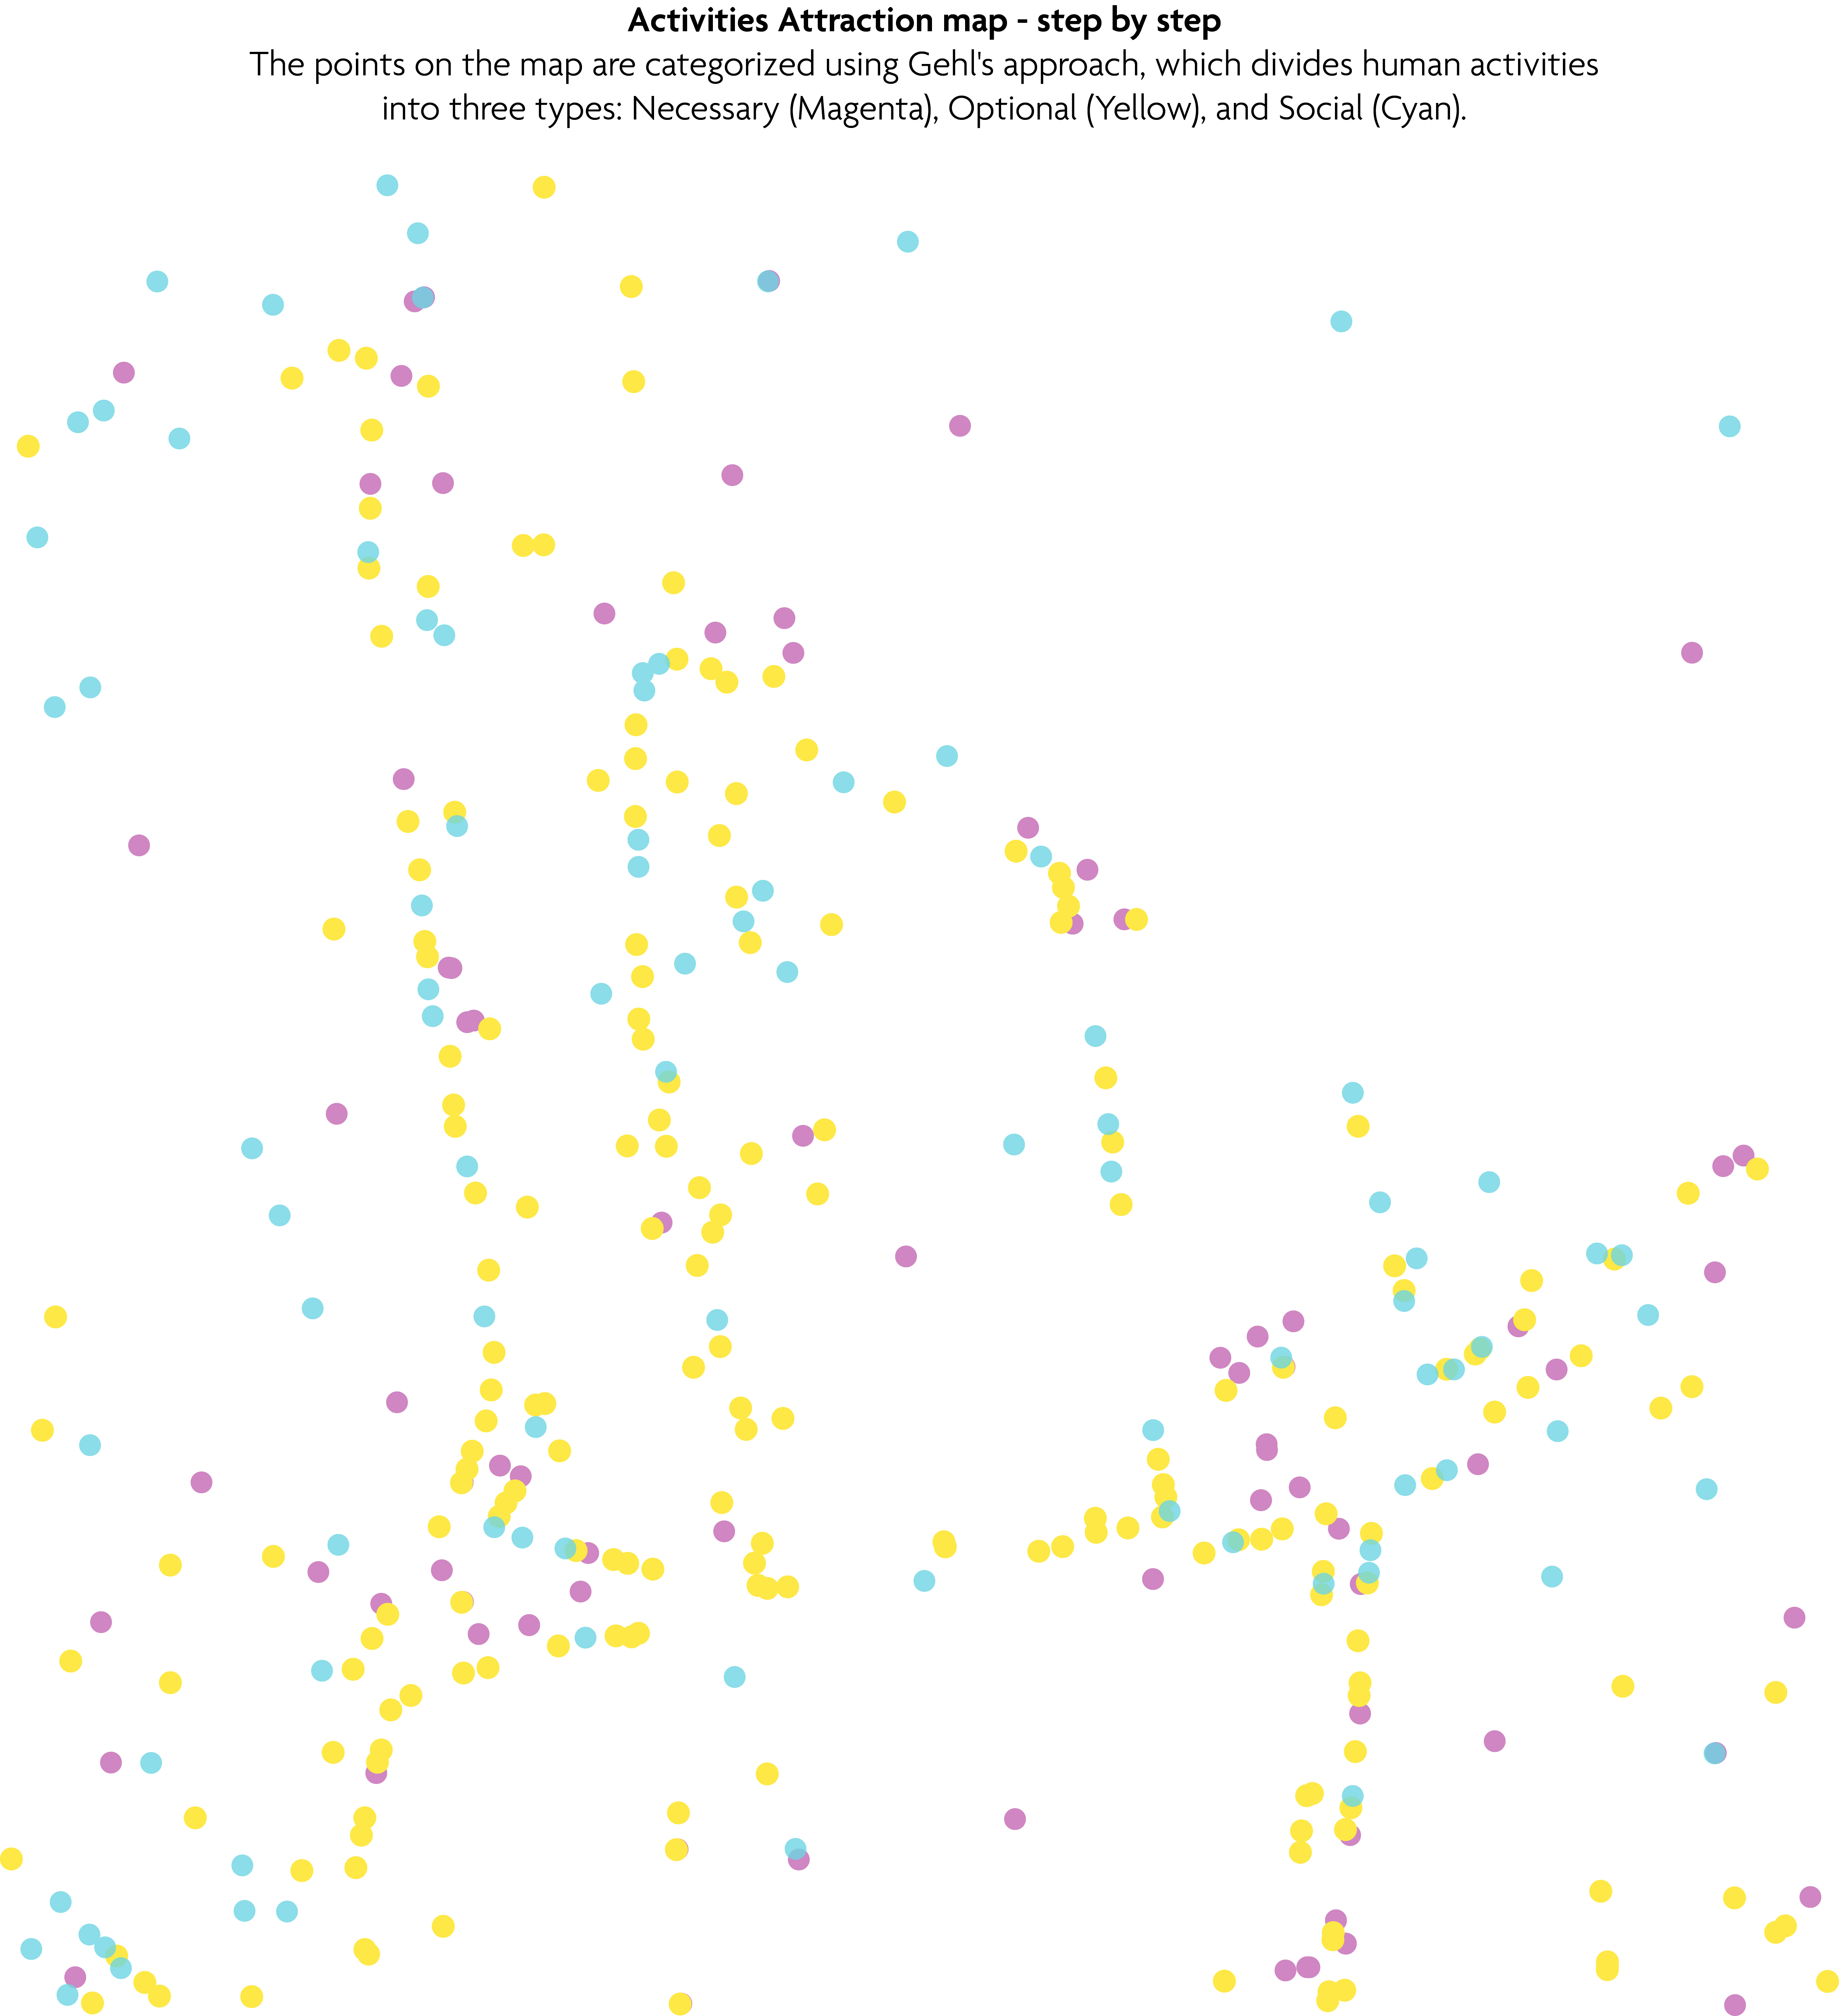
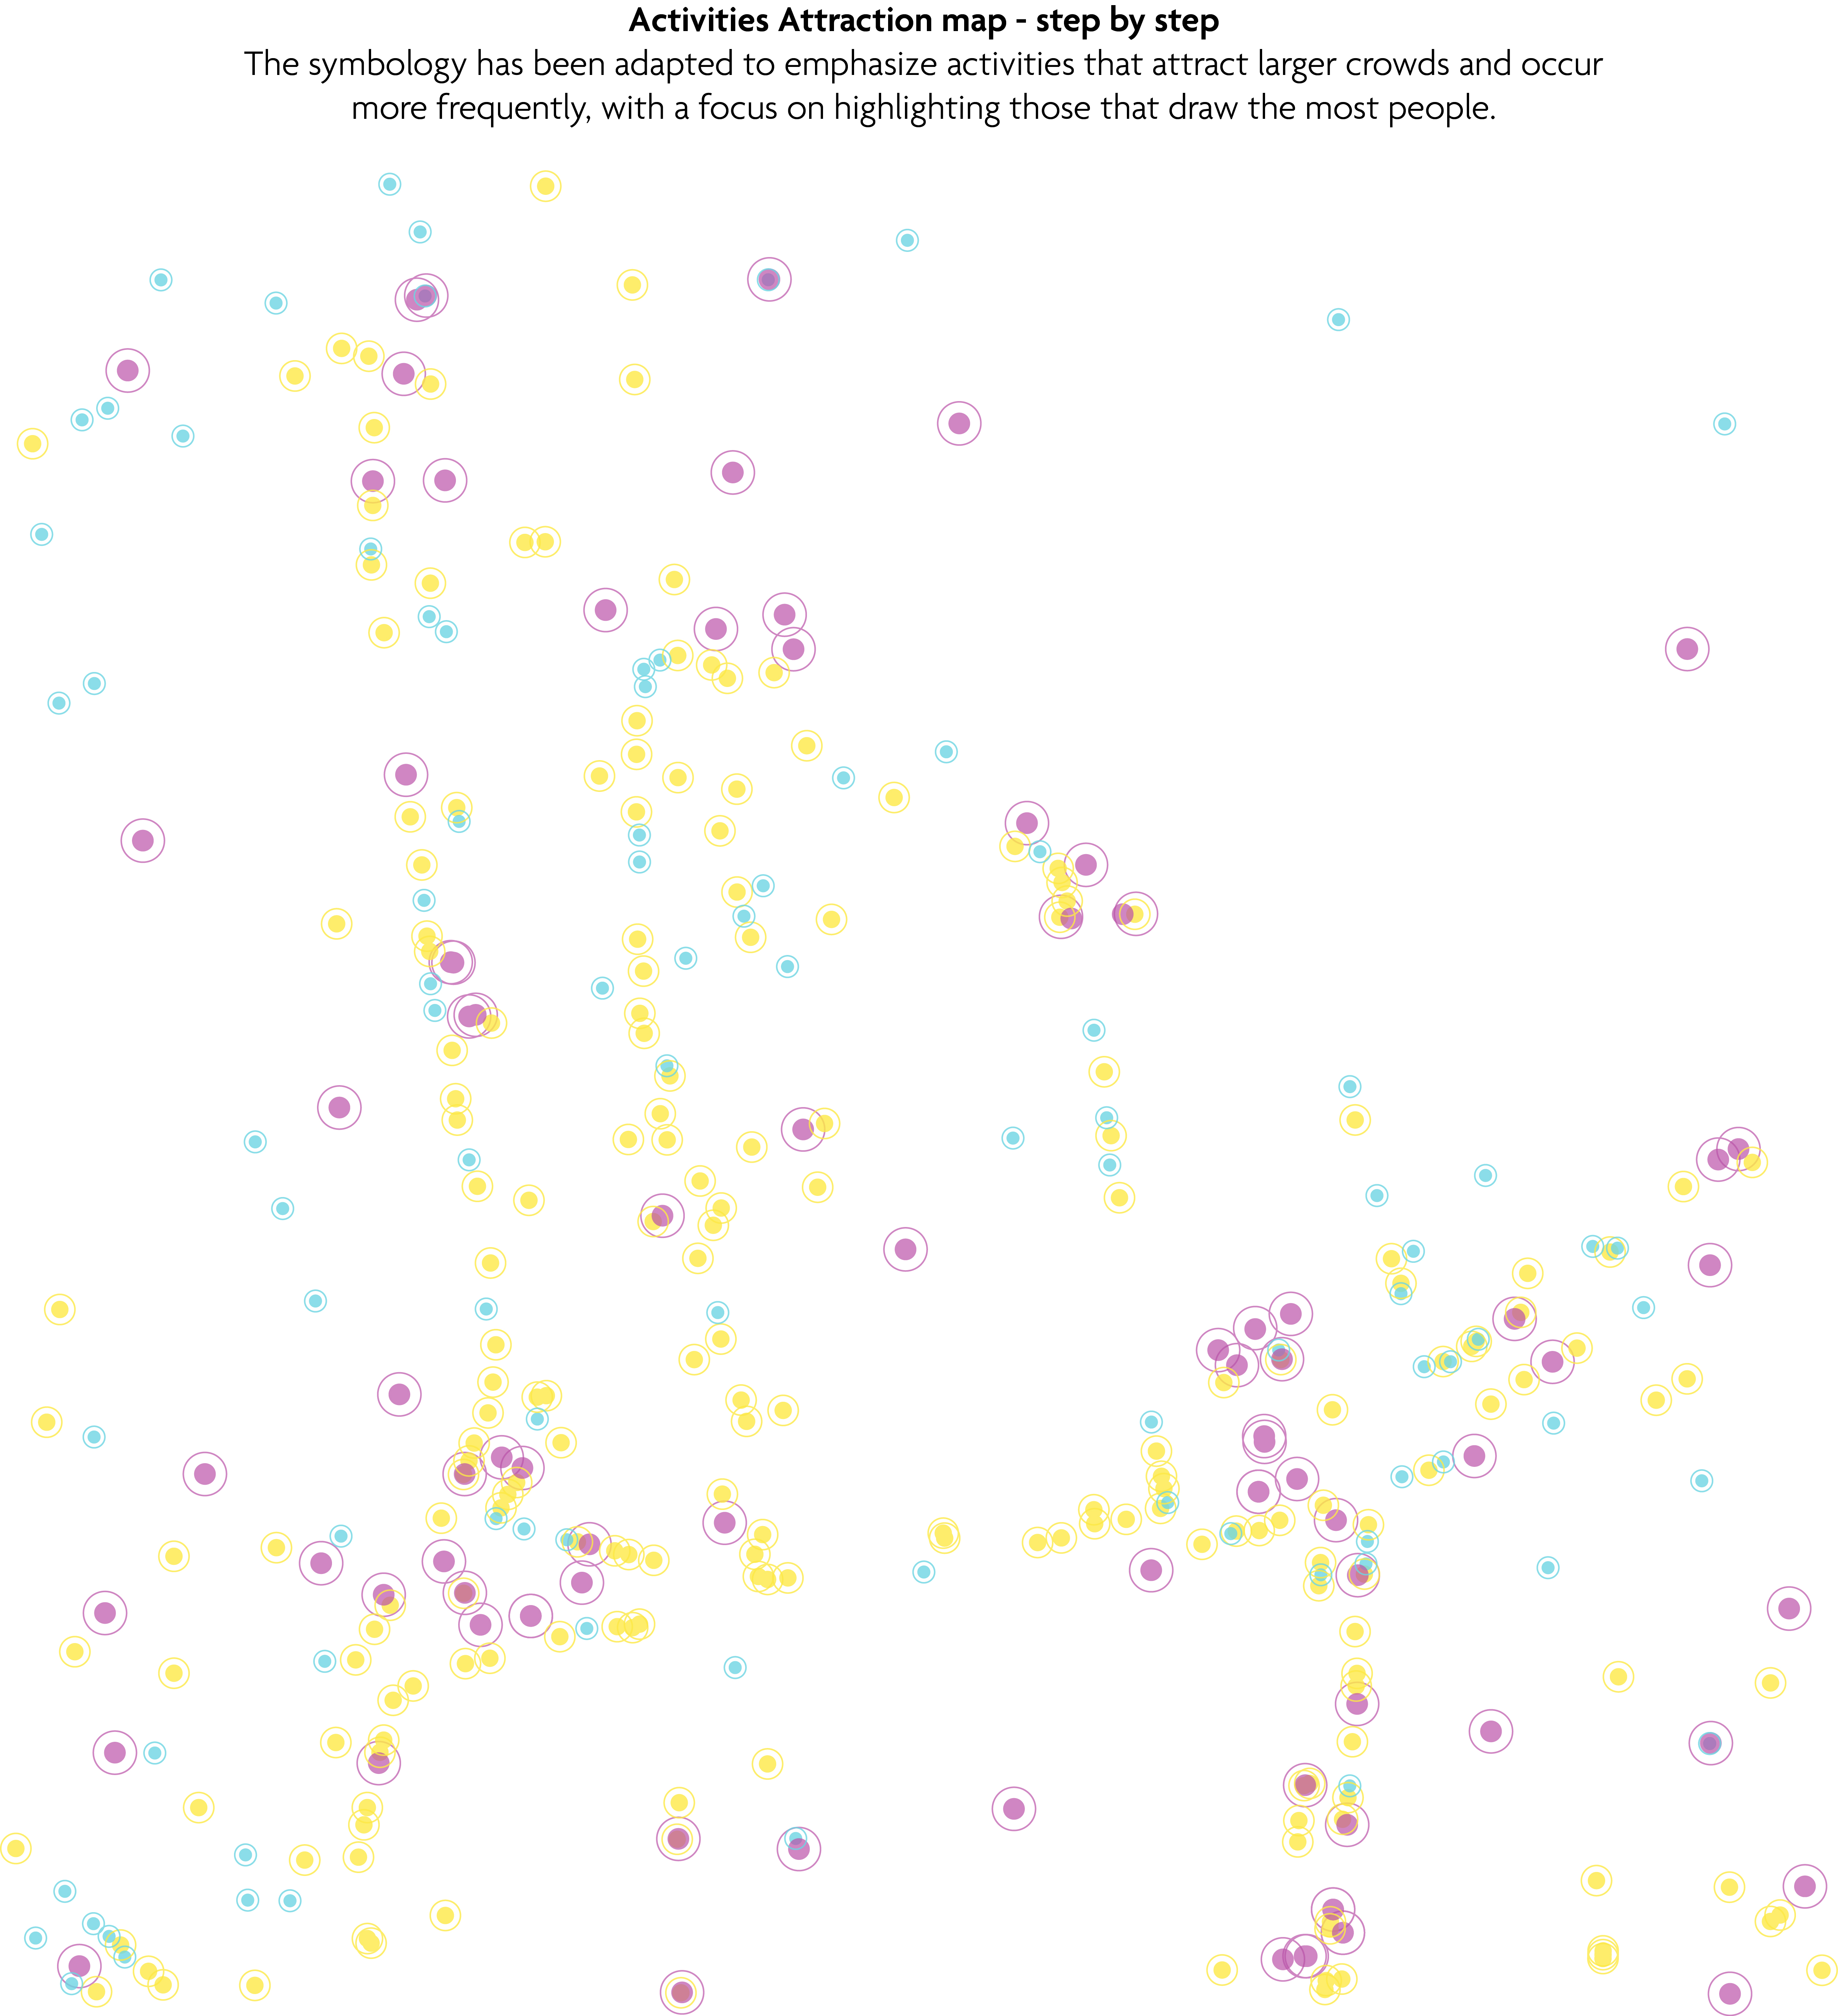
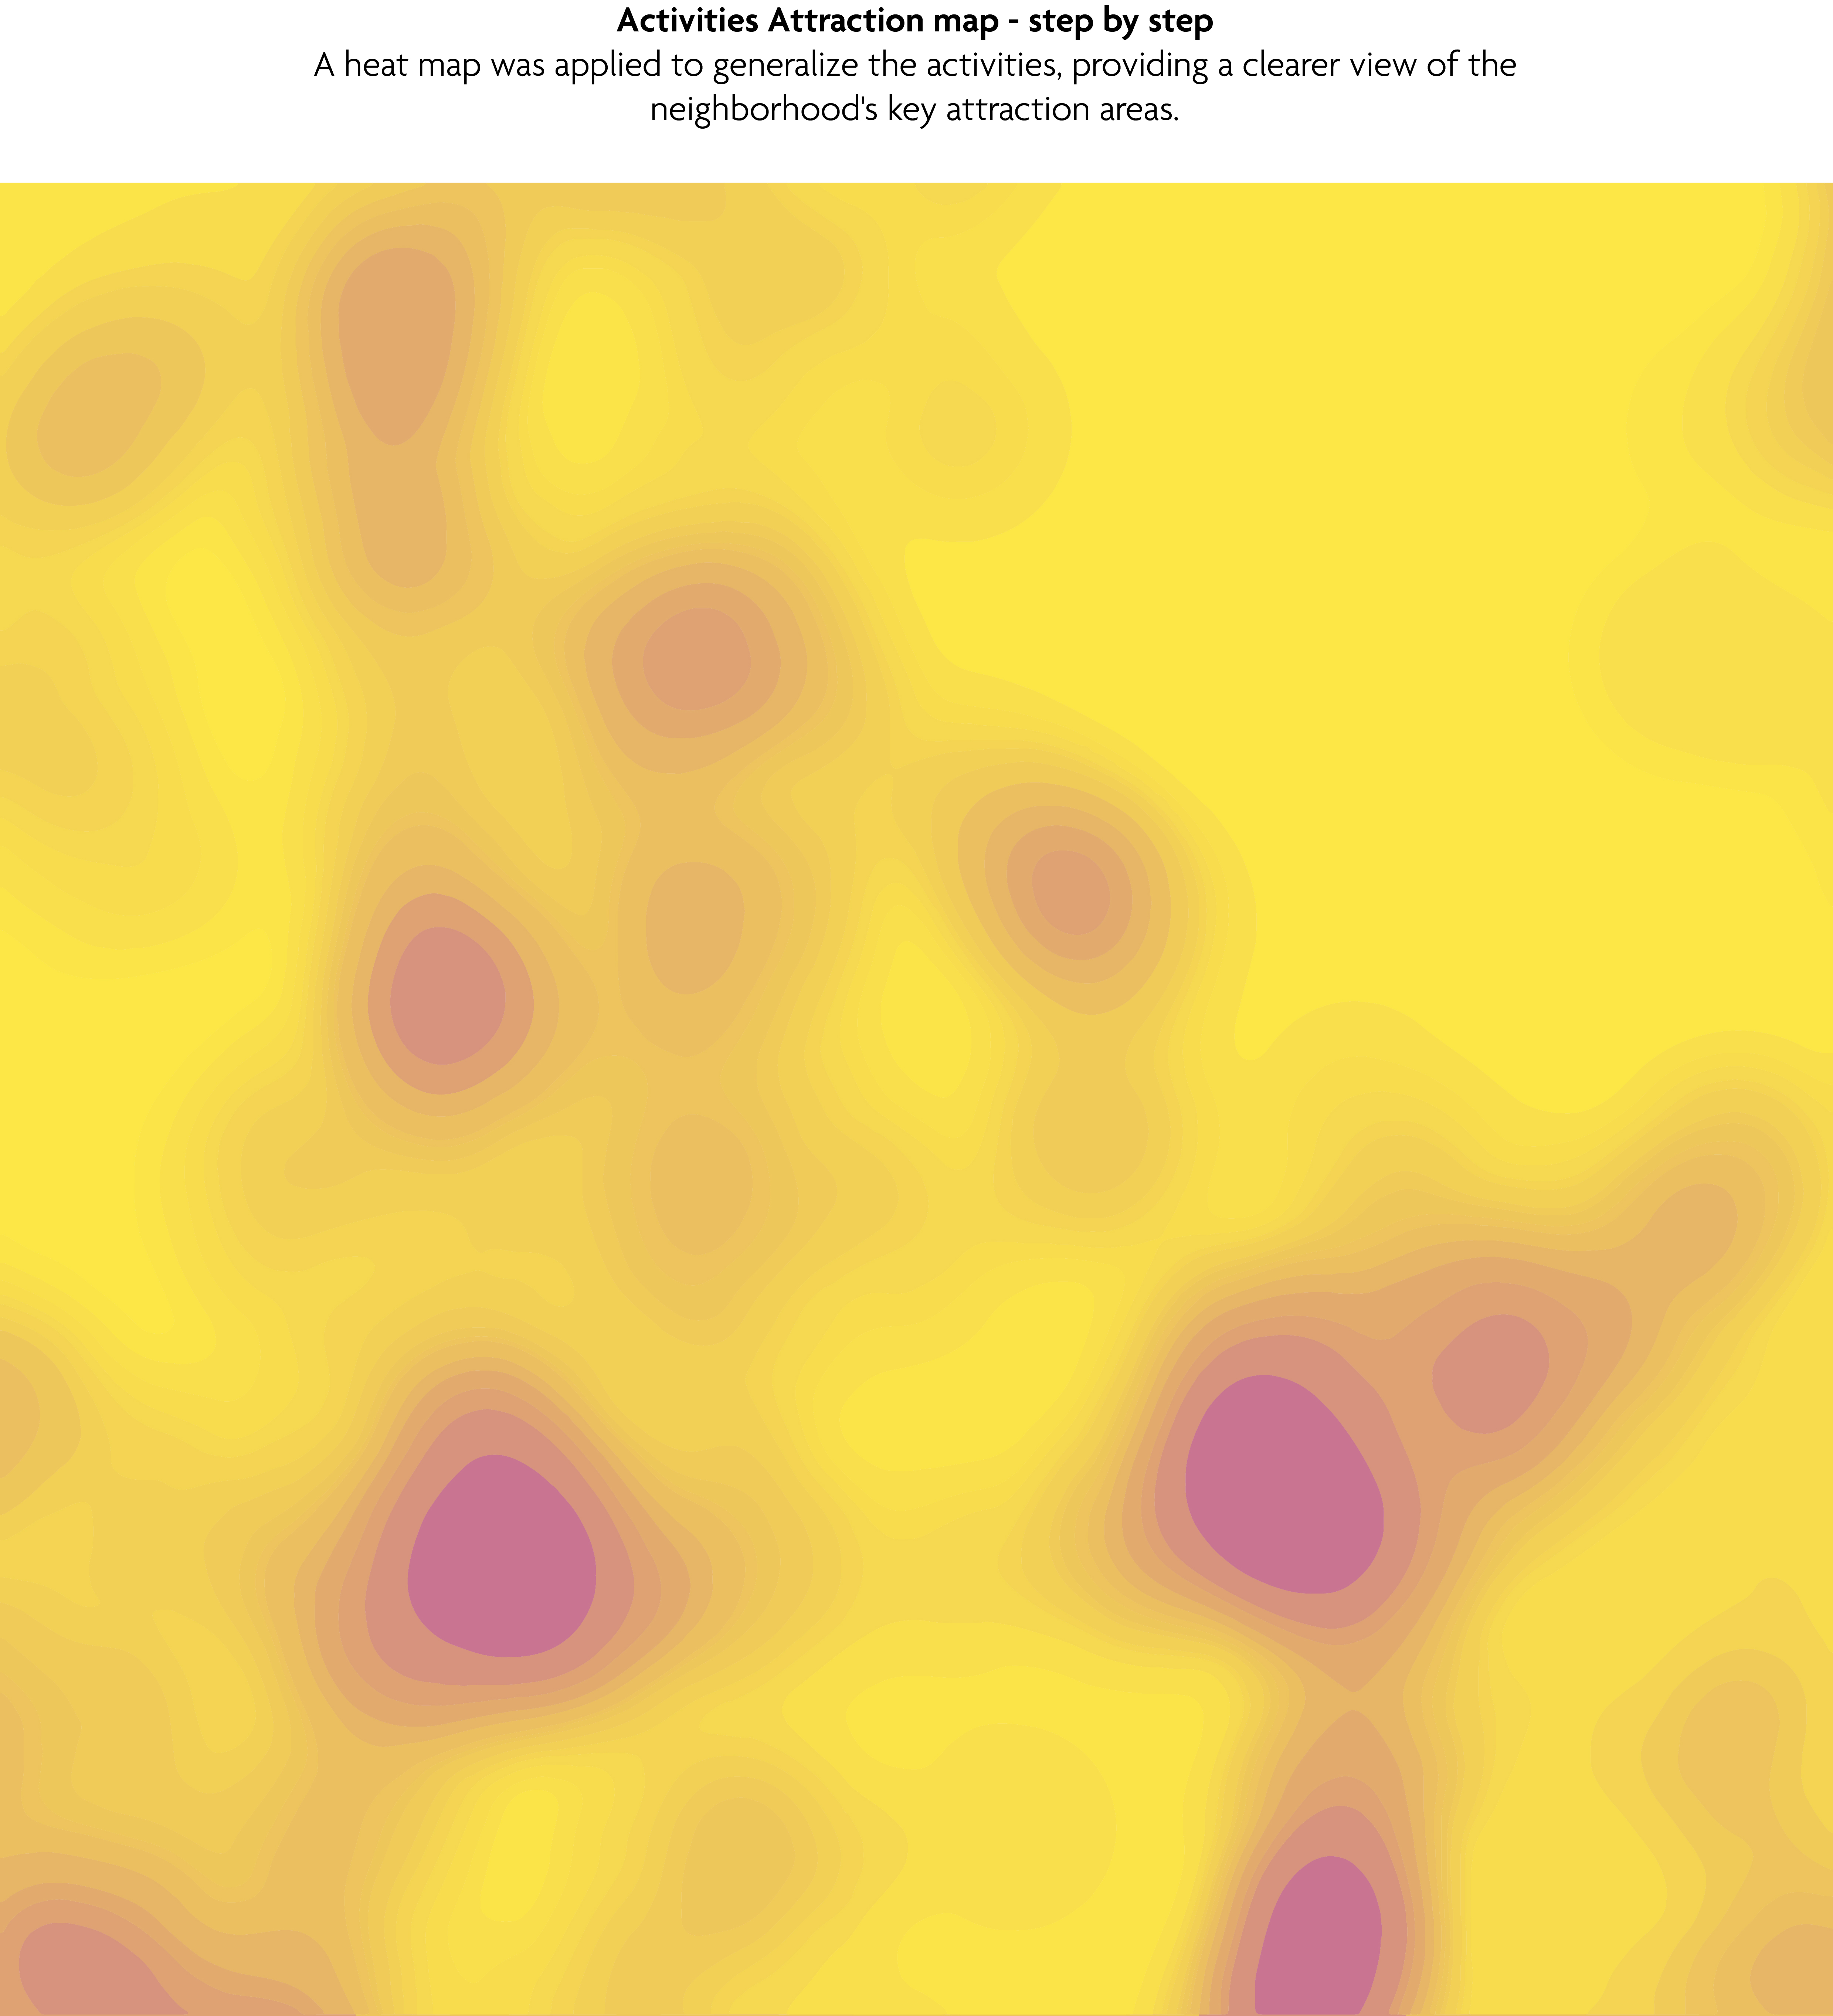
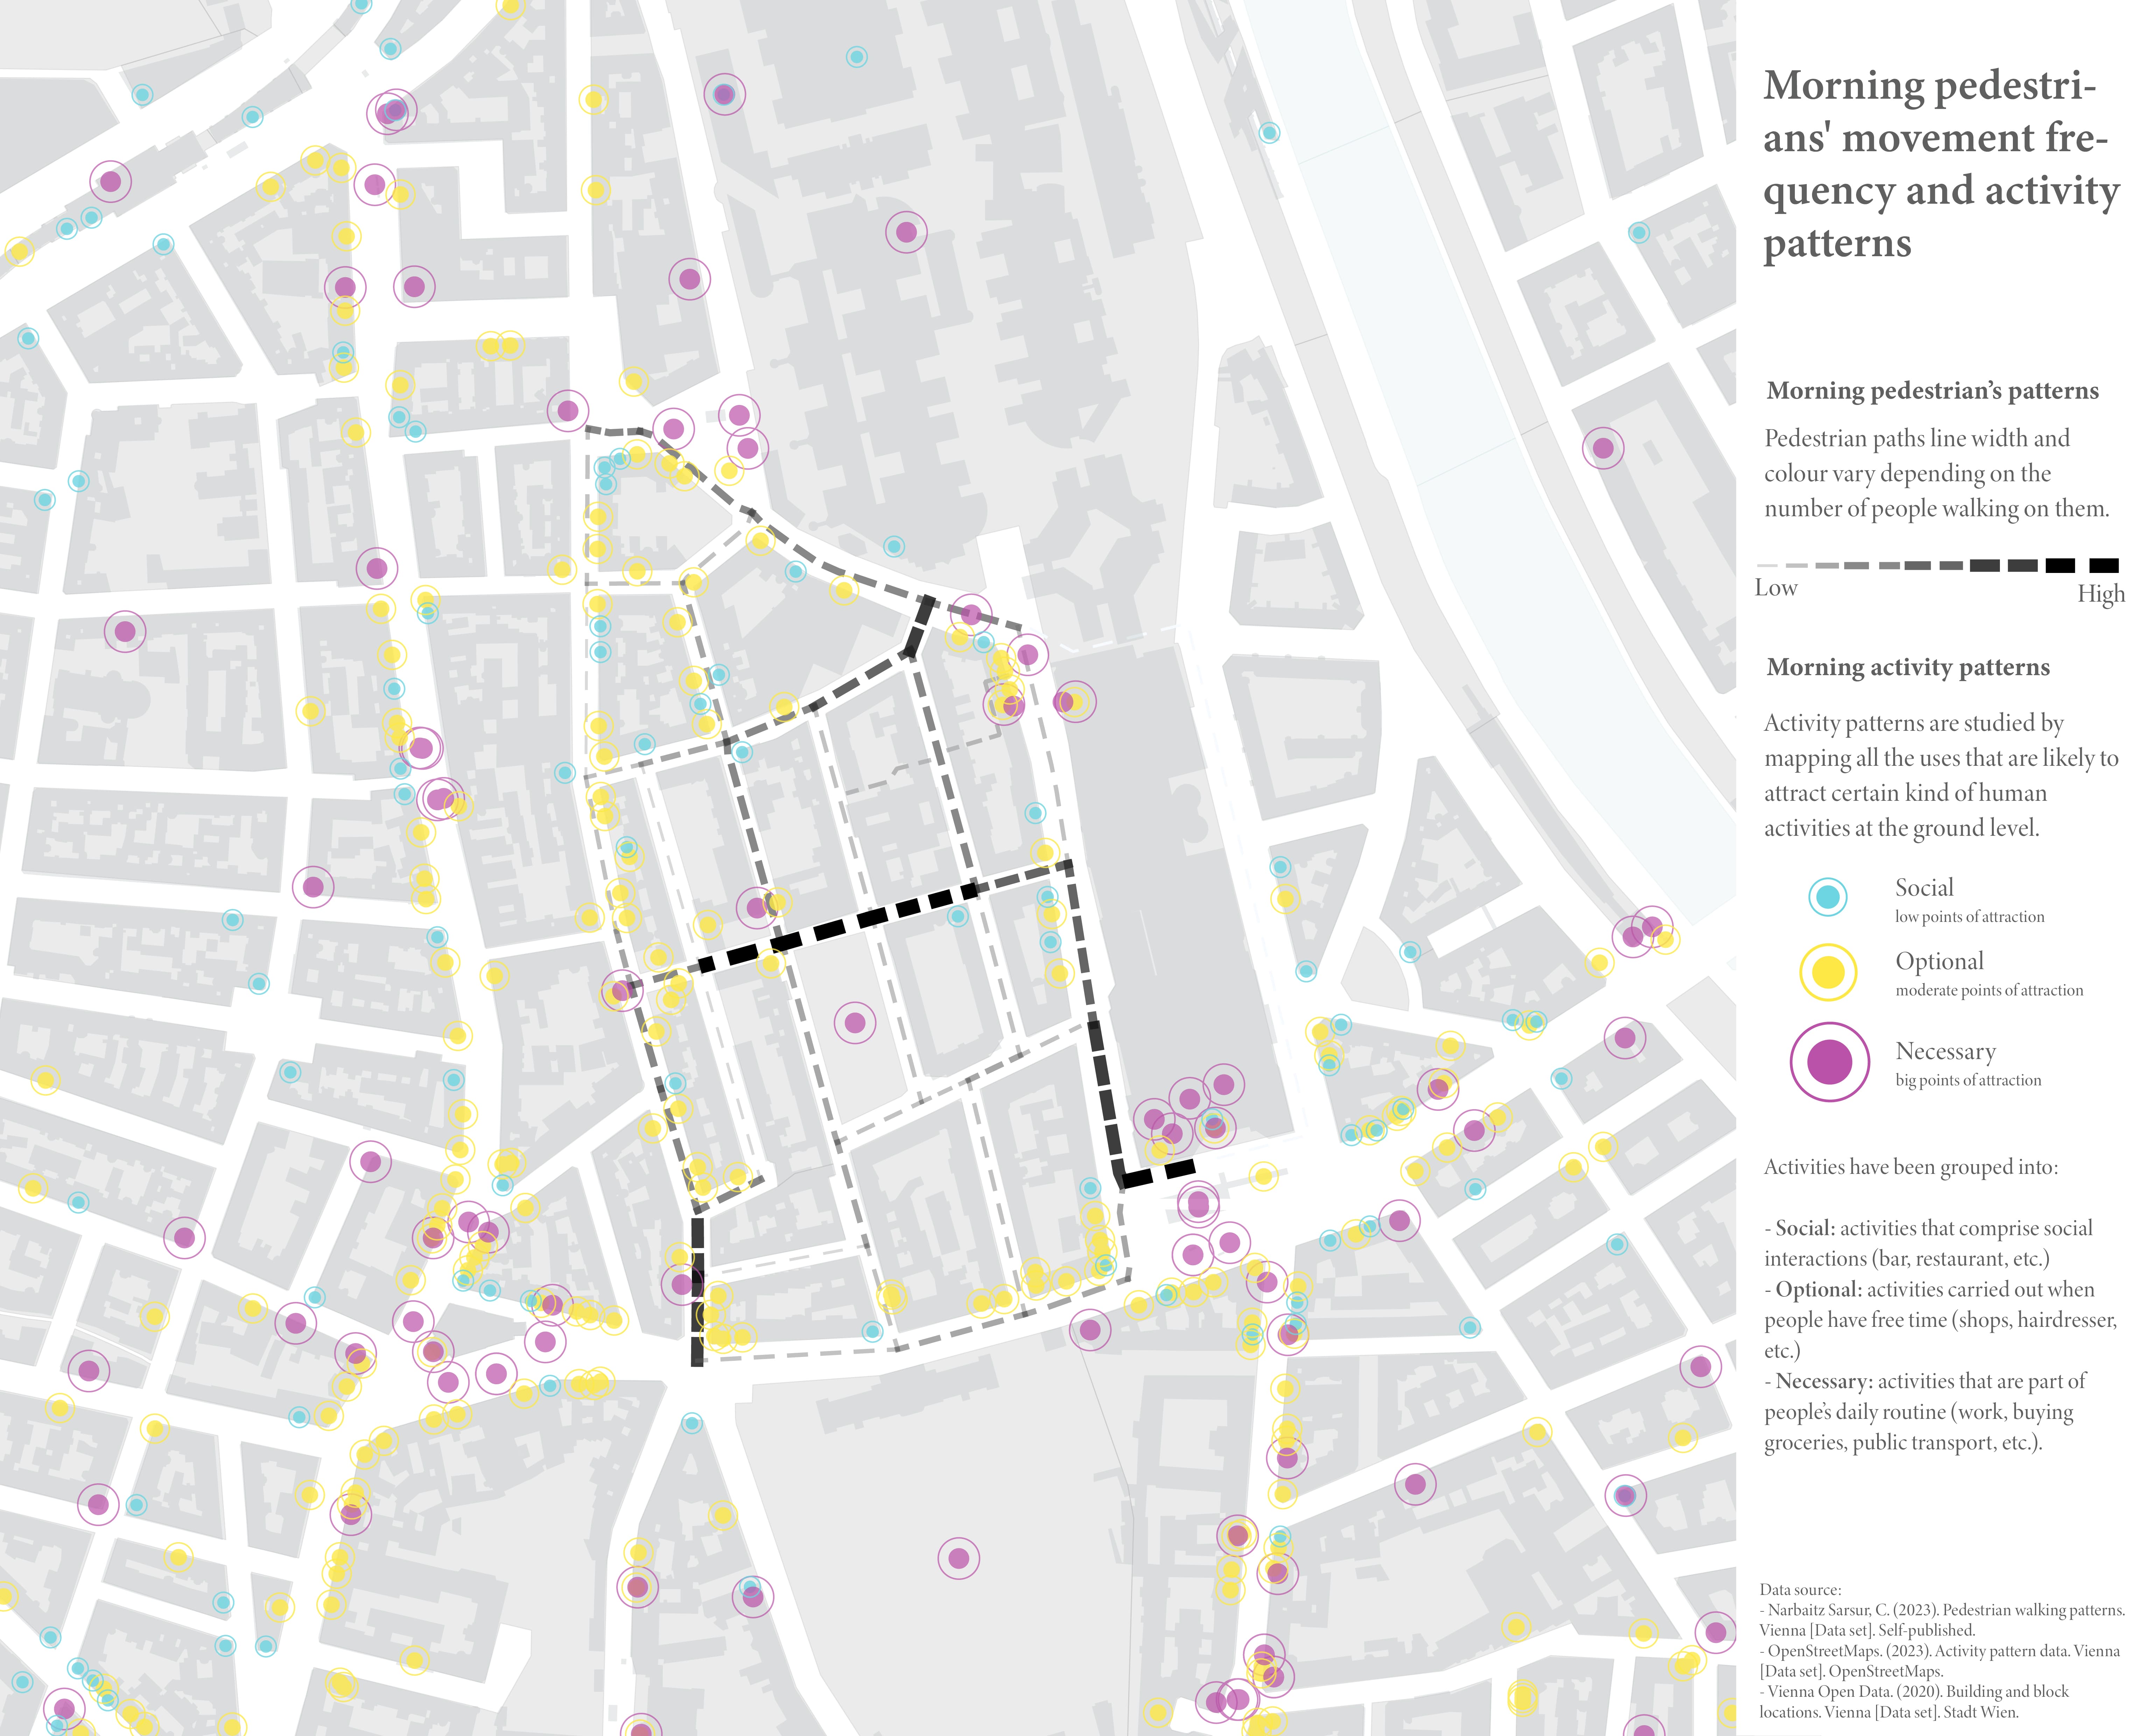
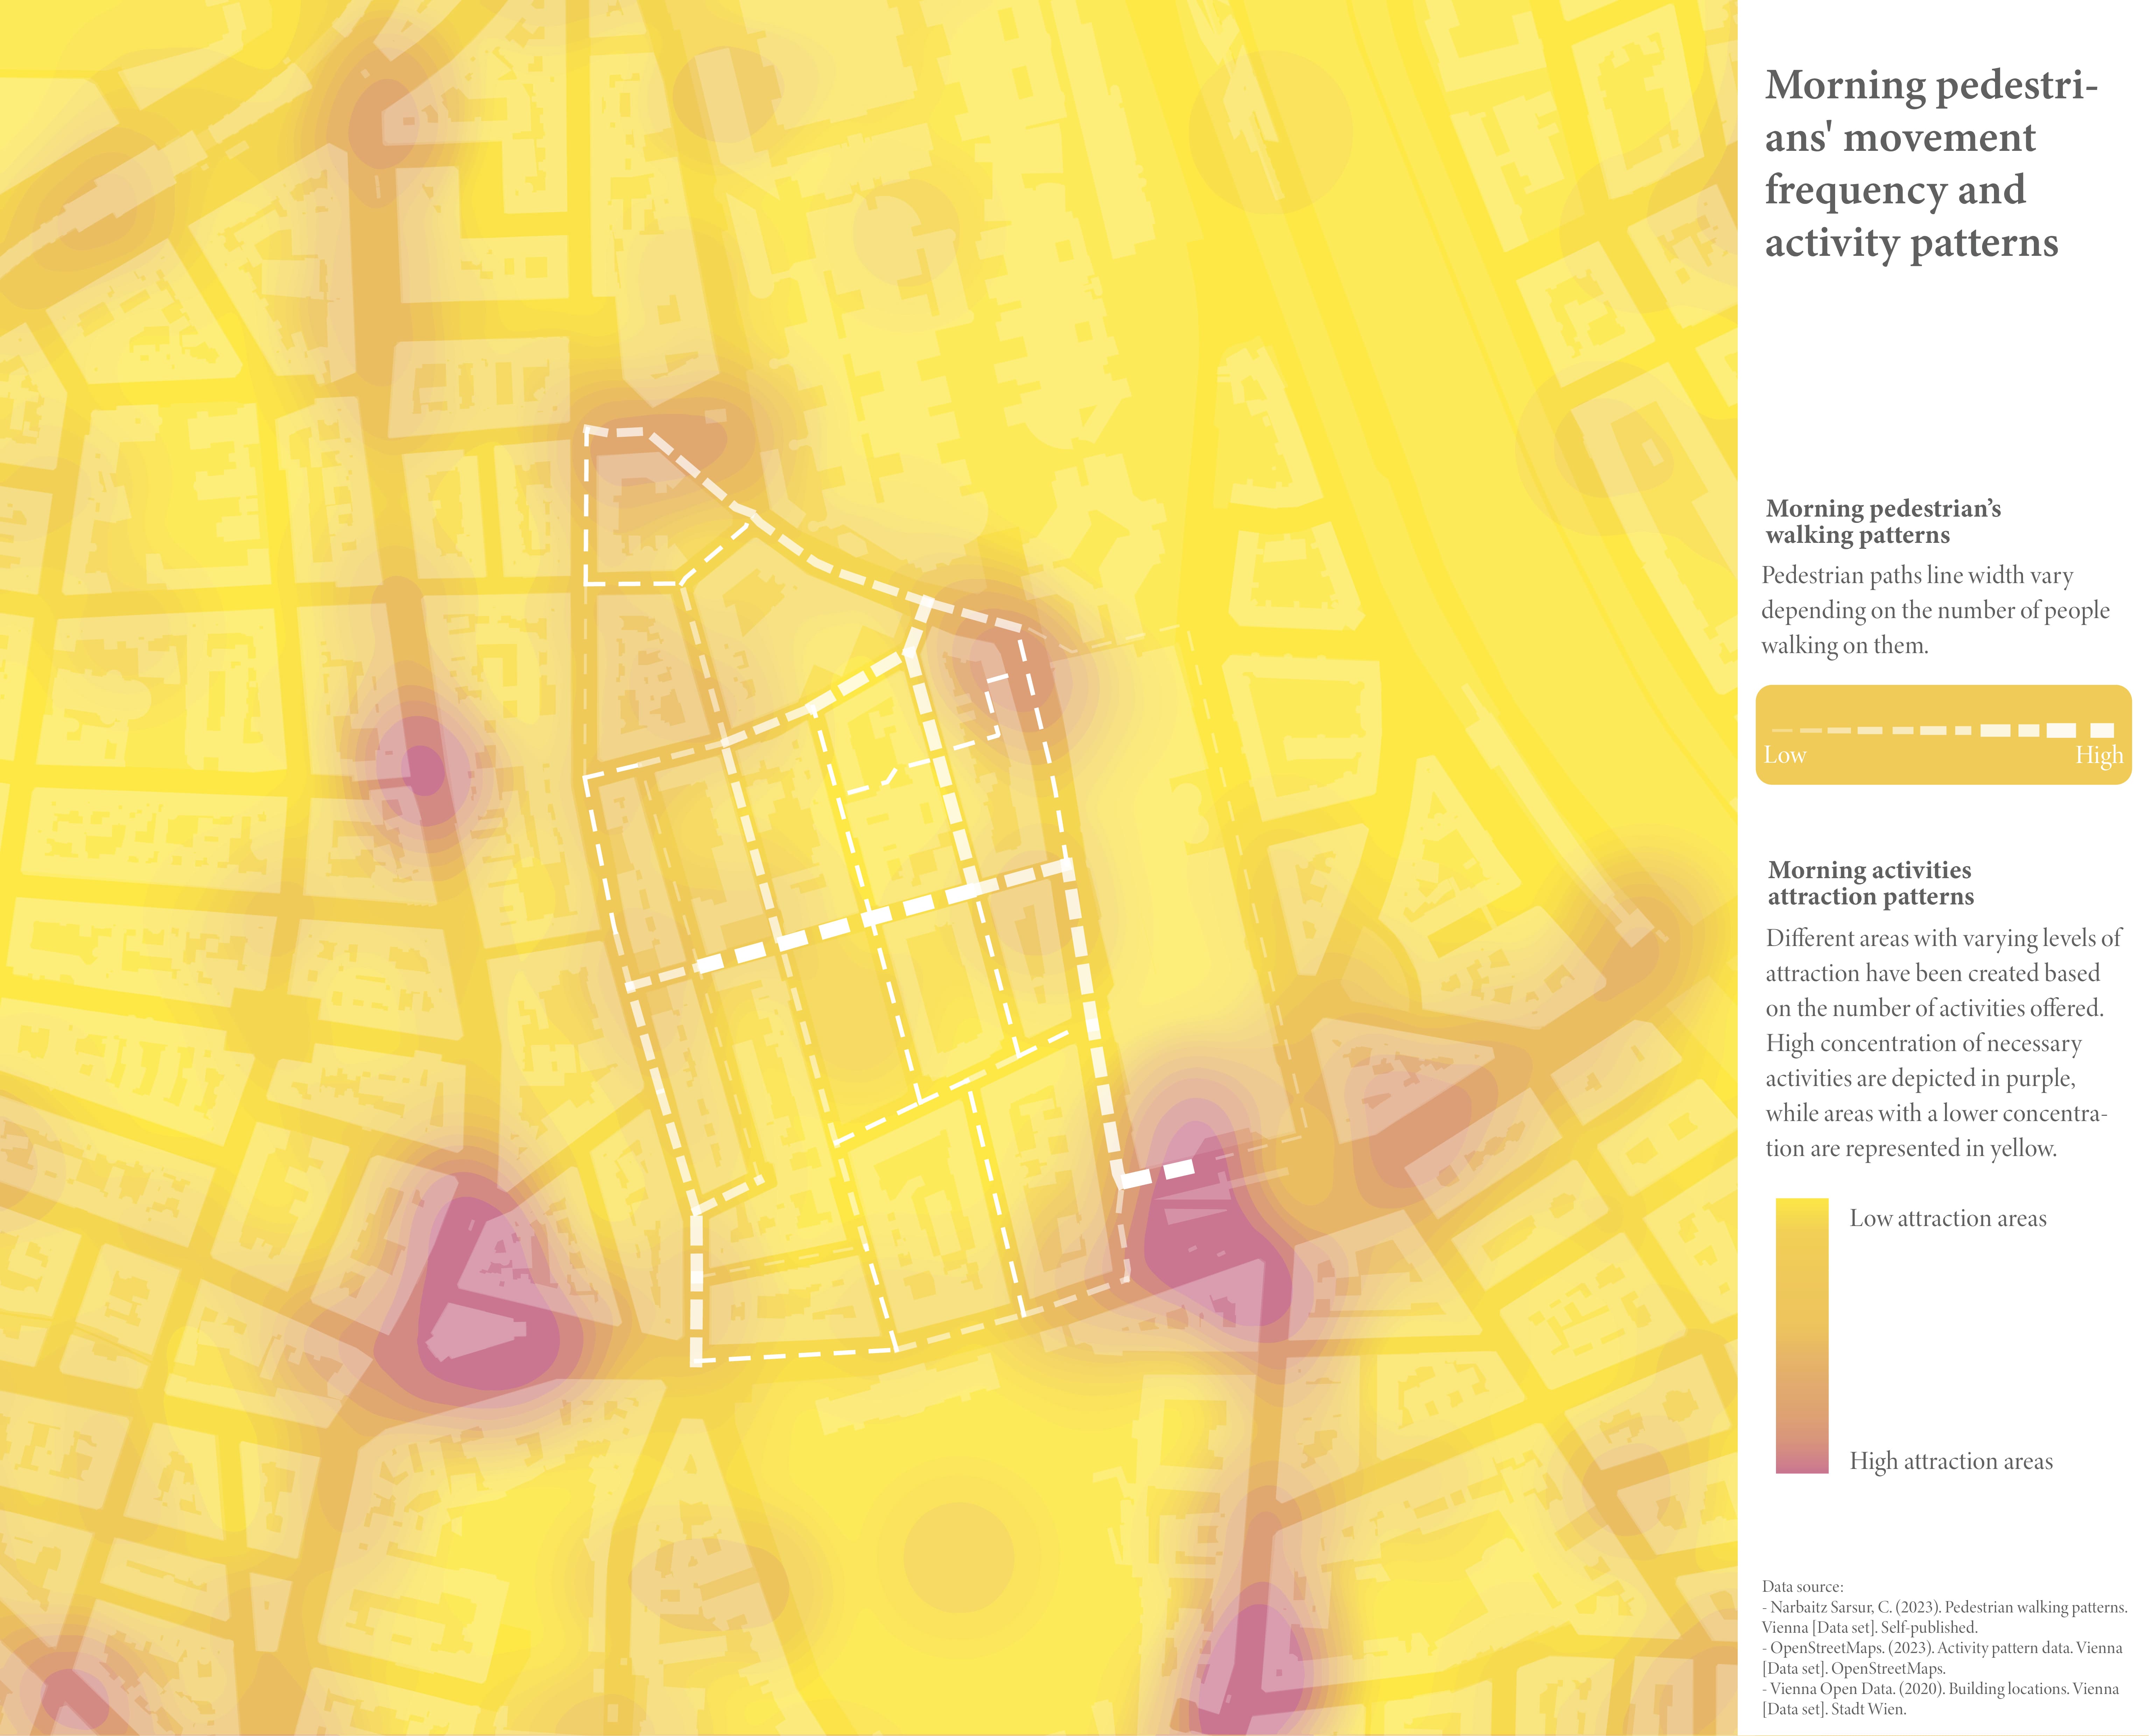
These maps aim to visualize the relationship between people's movement around Lichtental and the activity patterns mapped through the uses that are likely to attract certain kind of human activities at a ground level. The activities were grouped into: social, comprising social interactions; optional, activities carried out during free time; necessary, daily routine activities. The map on the left shows it with a high granularity and the map on the left provides a generalized representation in the form of a heatmap which clearly represents high activity areas. The heatmap was made by weighting activities depending on the intesity of use.
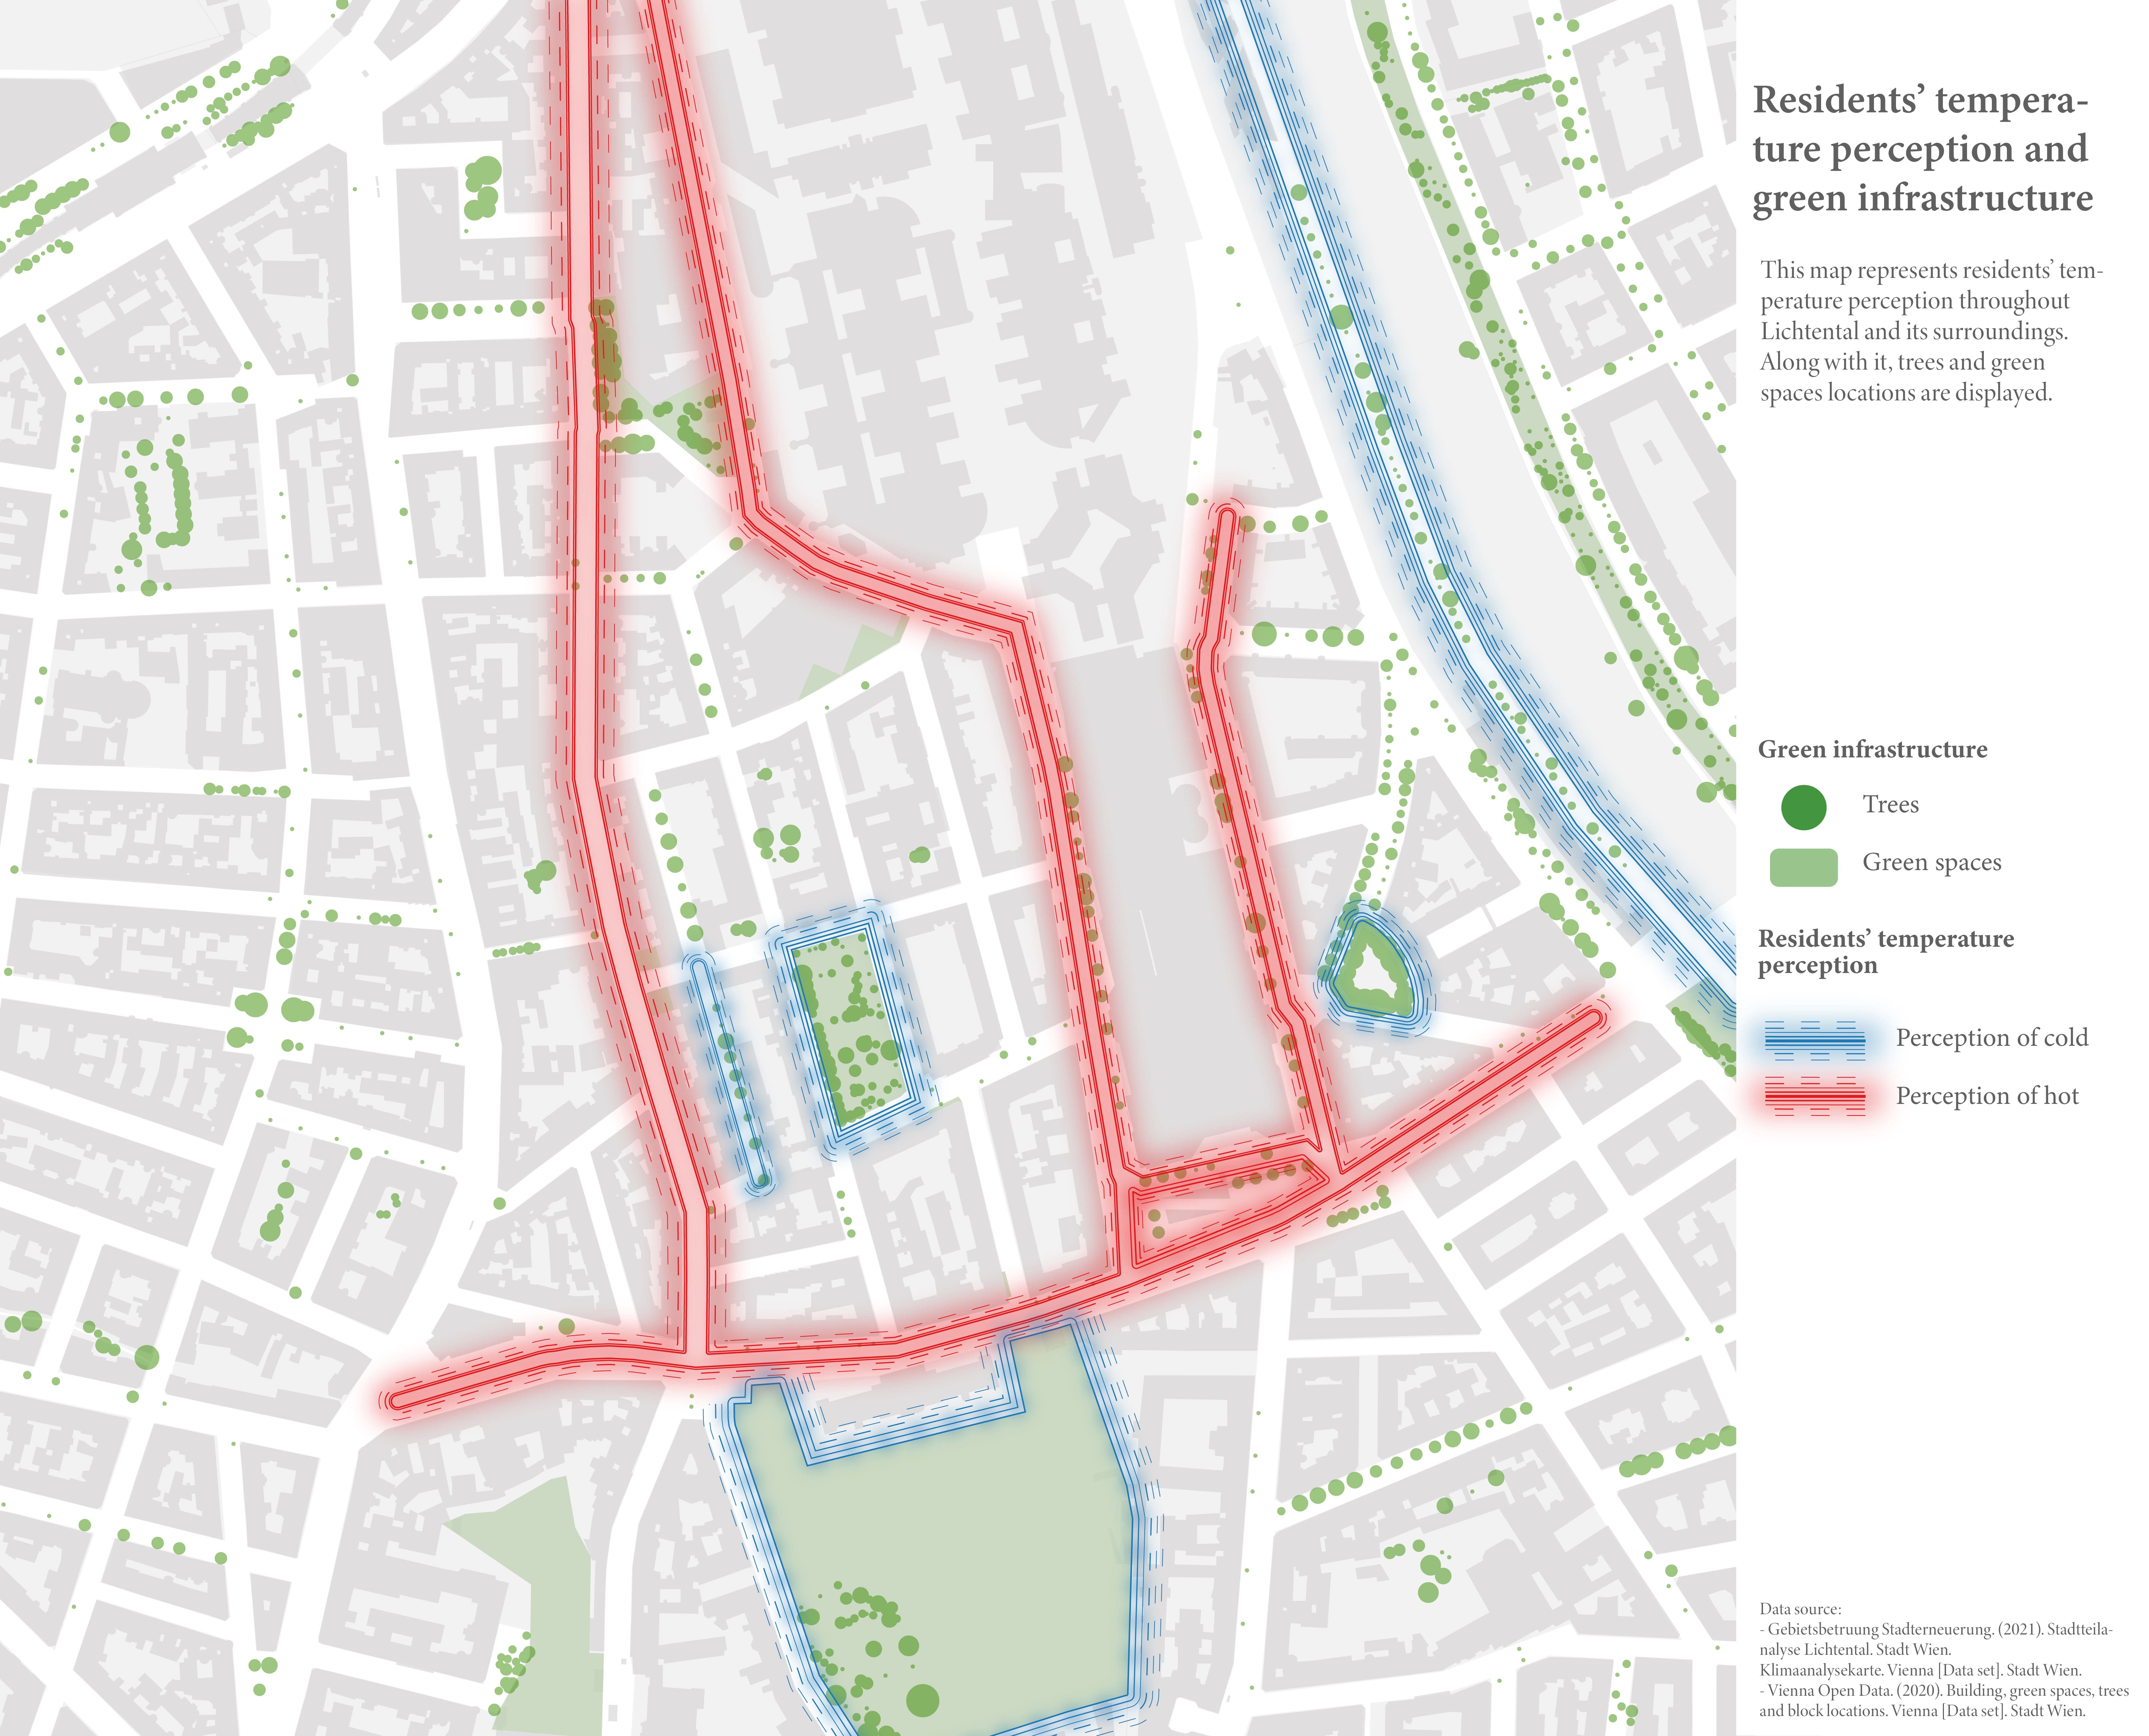
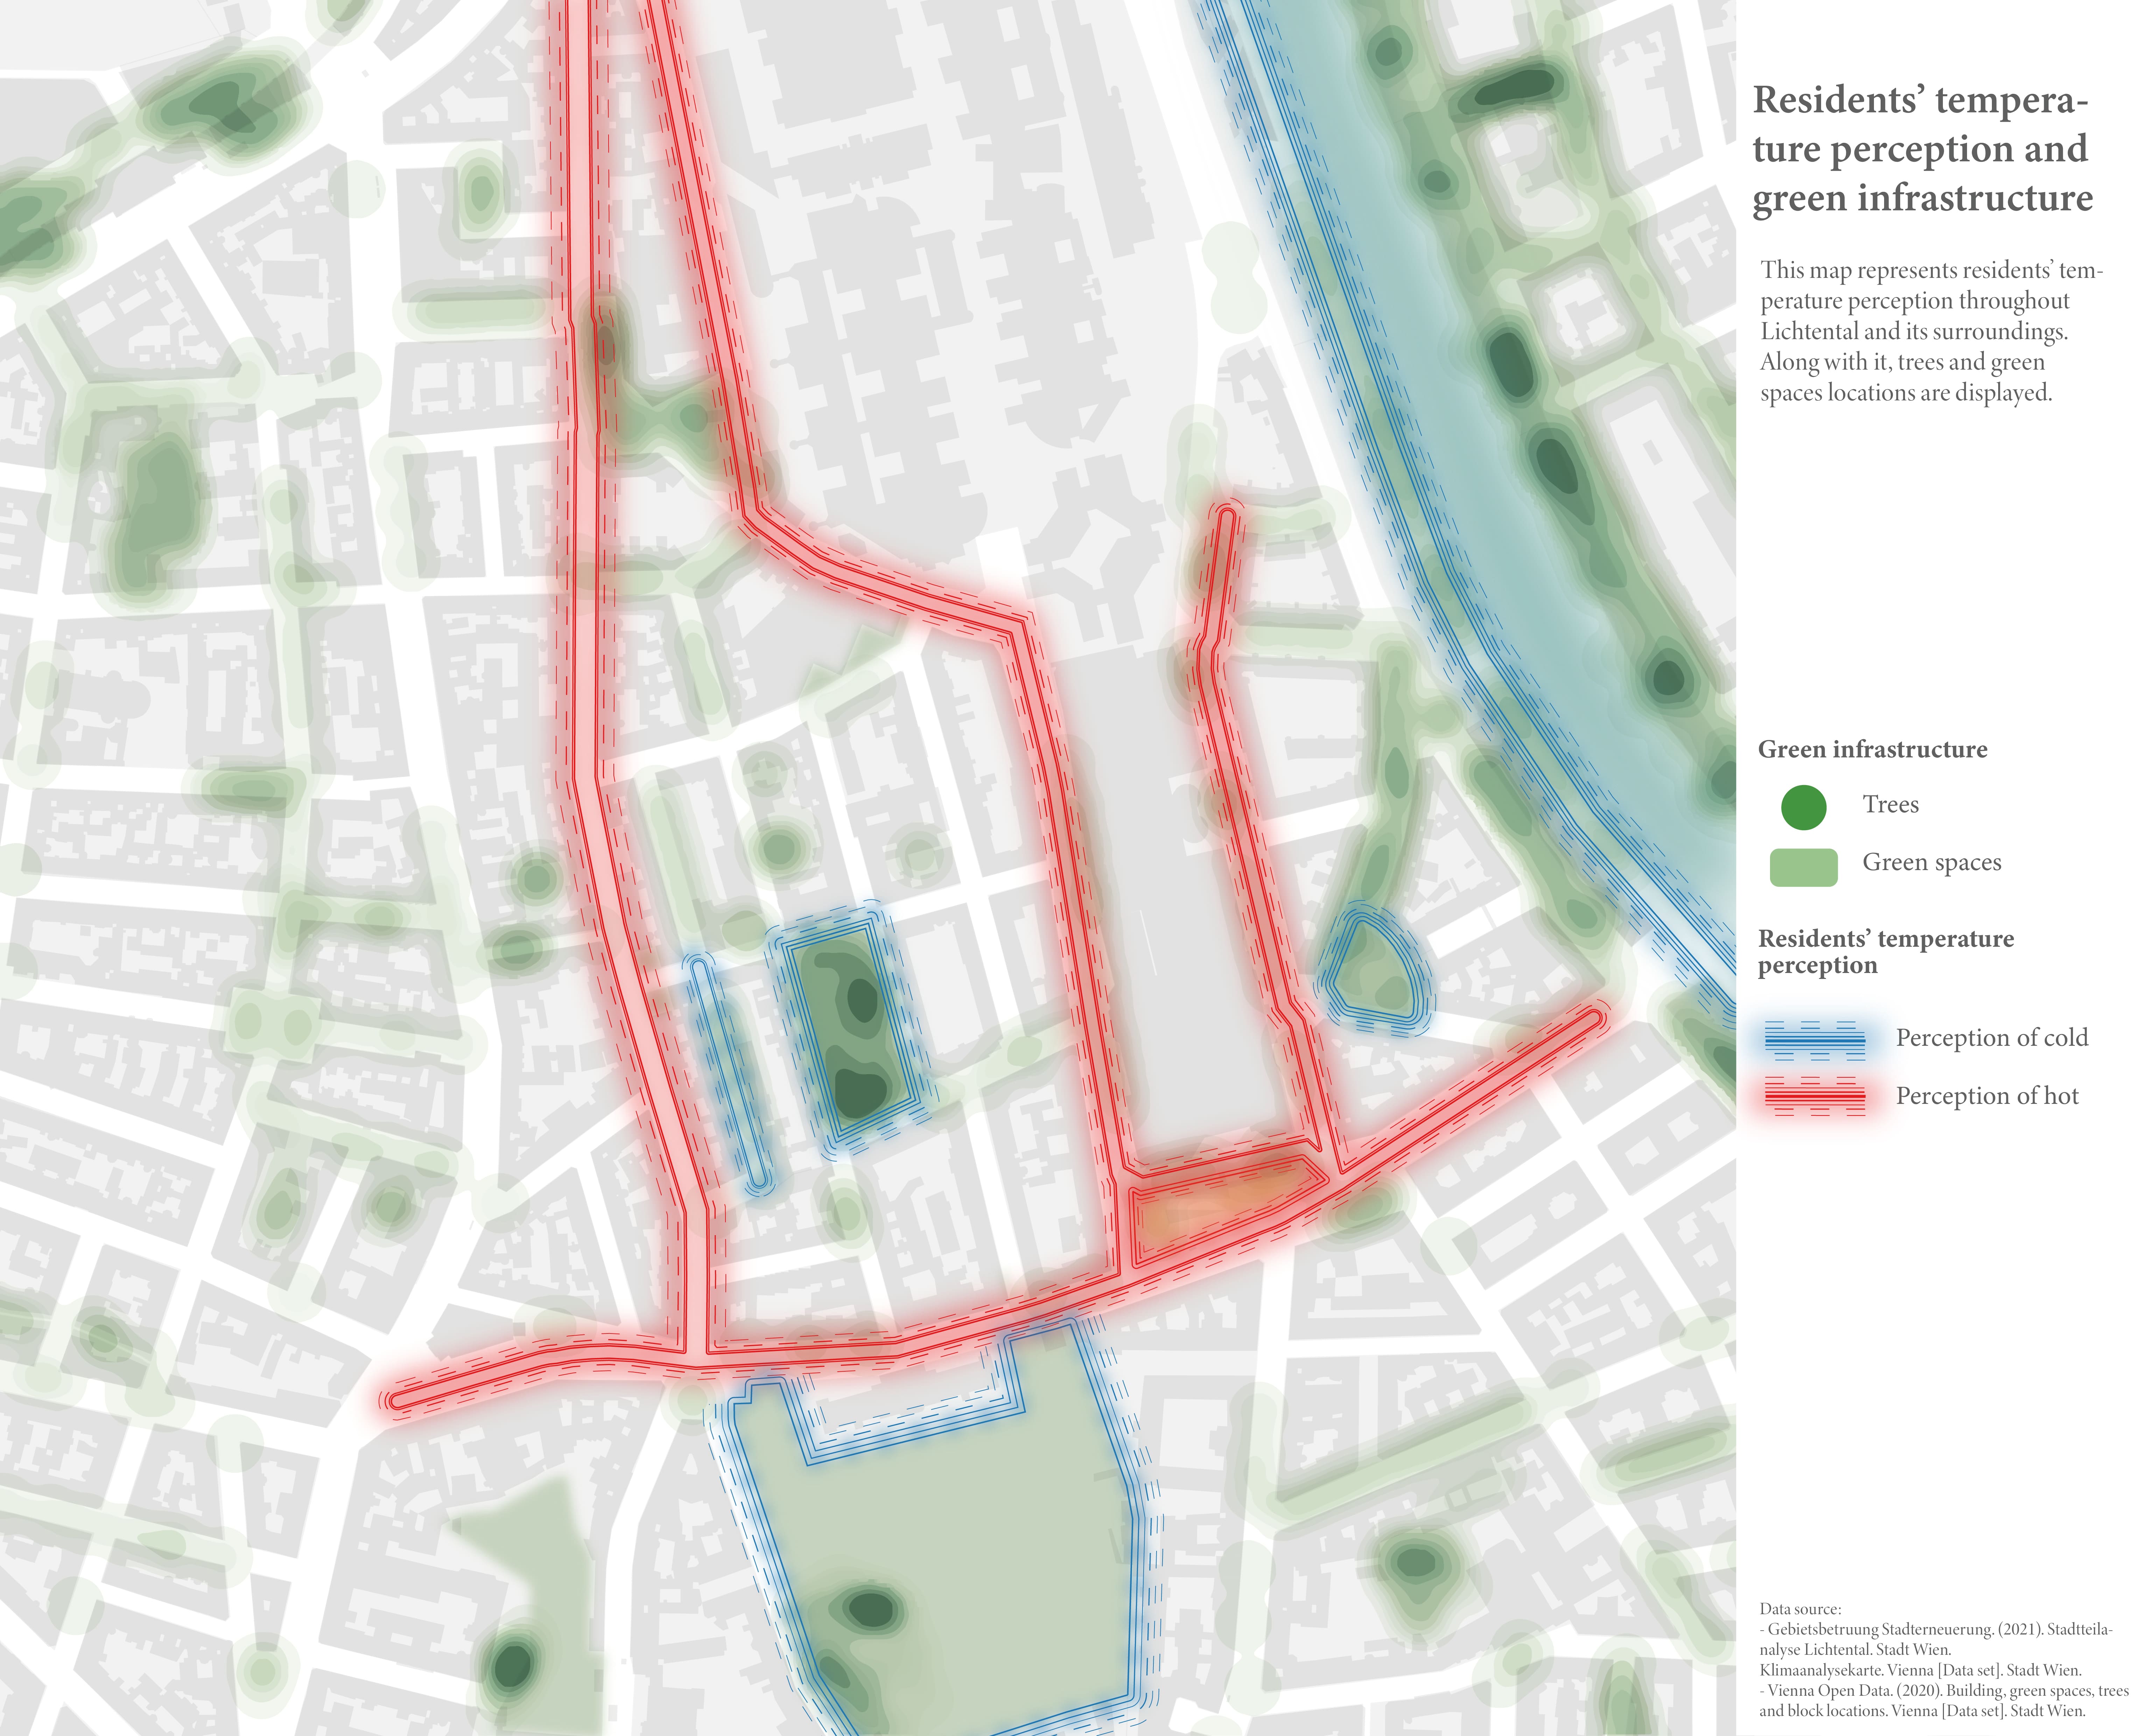
Residents' perception of temperature is combined with green spaces and trees. On the right the granularity of trees shows each positions and relative crown size. On the left a generalized representation in the form of a heatmap provides a broader view of the greenery's impact.
Softwares used: QGIS, OSM, R, Illustrator